Facebook Page Report

Facebook Page Report Template

Monitor user engagement and content effectiveness with Swydo’s customizable Facebook Page report template. 

Set goals and track engagement KPIs to measure and analyze your Facebook Page’s performance. Gain insights into the types of content that resonate with your audience to enhance your Facebook organic strategy.

Data sources Facebook Insights
Preview ▶ Get started

Free for 14 days

No credit card required

Cancel anytime

Facebook Page Report

How it works

select template white

1. Select

Choose one of our predefined templates or create your own

connect white

2. Connect

Connect your data sources

customize white

3. Customize

Customize your data to meet your client’s needs

share white

4. Share

Schedule and share a dashboard or PDF report with your team or clients

Choose Swydo's Facebook Page Report Template

Save time, impress clients, and grow your agency with Swydo's automated reporting solutions.

Swydo item

Save Hours
Streamline reporting and reclaim your day.

Swydo item

Actionable Insights
Present key Facebook Page metrics in a way that clients instantly understand.

Swydo item

All-in-One Reporting
Visualize, share, and manage all your Facebook Page data from one spot.

Swydo item

Custom Branded Reports
Present clients with tailored, on-brand Facebook Page reports.

Swydo item

Agency Mark-up
Set your agency markup once. Flat or percentage & auto-apply.

Swydo item

Win More Business
Impress in pitches with Facebook Page reports that showcase your expertise.

Why Your Agency Needs a Facebook Page Insights Report Template

As a marketer, you want to drive results, not format spreadsheets. Save hours tracking Facebook Page performance with automated, branded reports that showcase social media expertise.

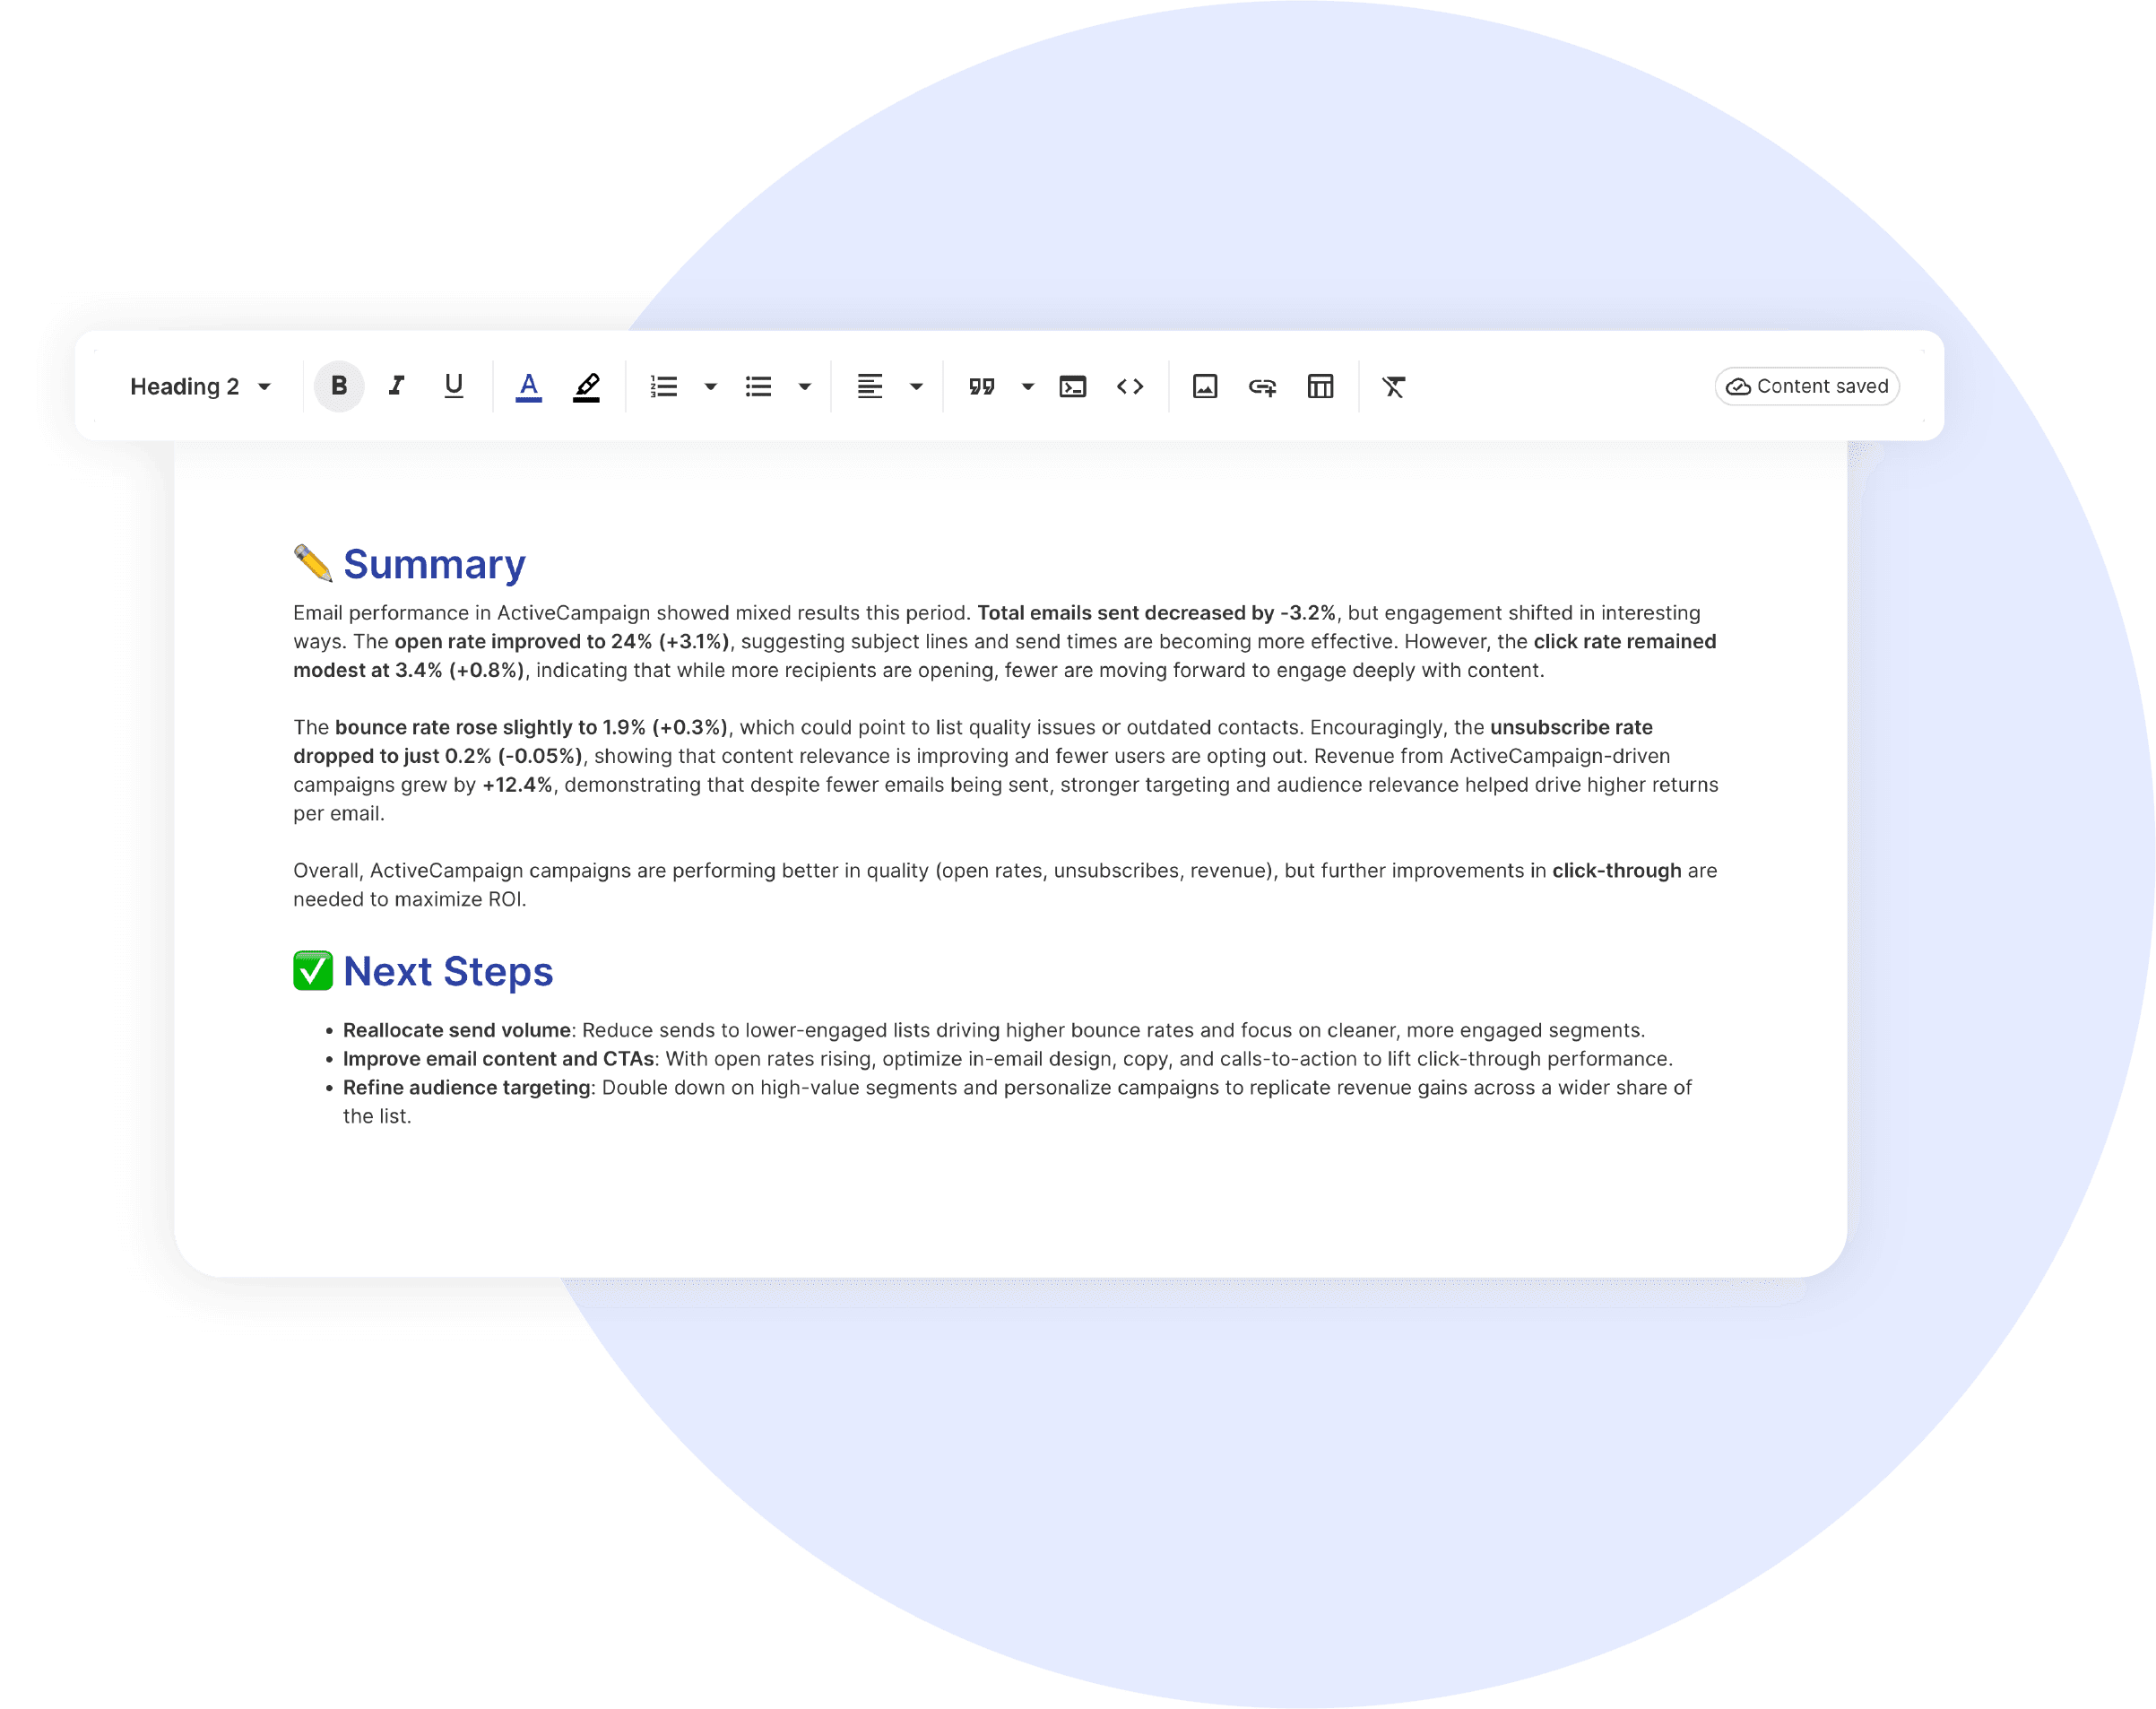
Every minute spent wrestling with Facebook data is a minute stolen from strategy. A good Facebook Page Insights template transforms scattered social metrics into stories clients actually understand.

No more late nights before presentations, no more explaining complex audience demographics from scratch, just clear insights that showcase your Facebook expertise and justify your premium fees. This Facebook Page Insights report template transforms chaotic page data into clear, compelling client presentations in minutes, not hours.


What Makes Swydo’s Facebook Page Insights Report Template Different?
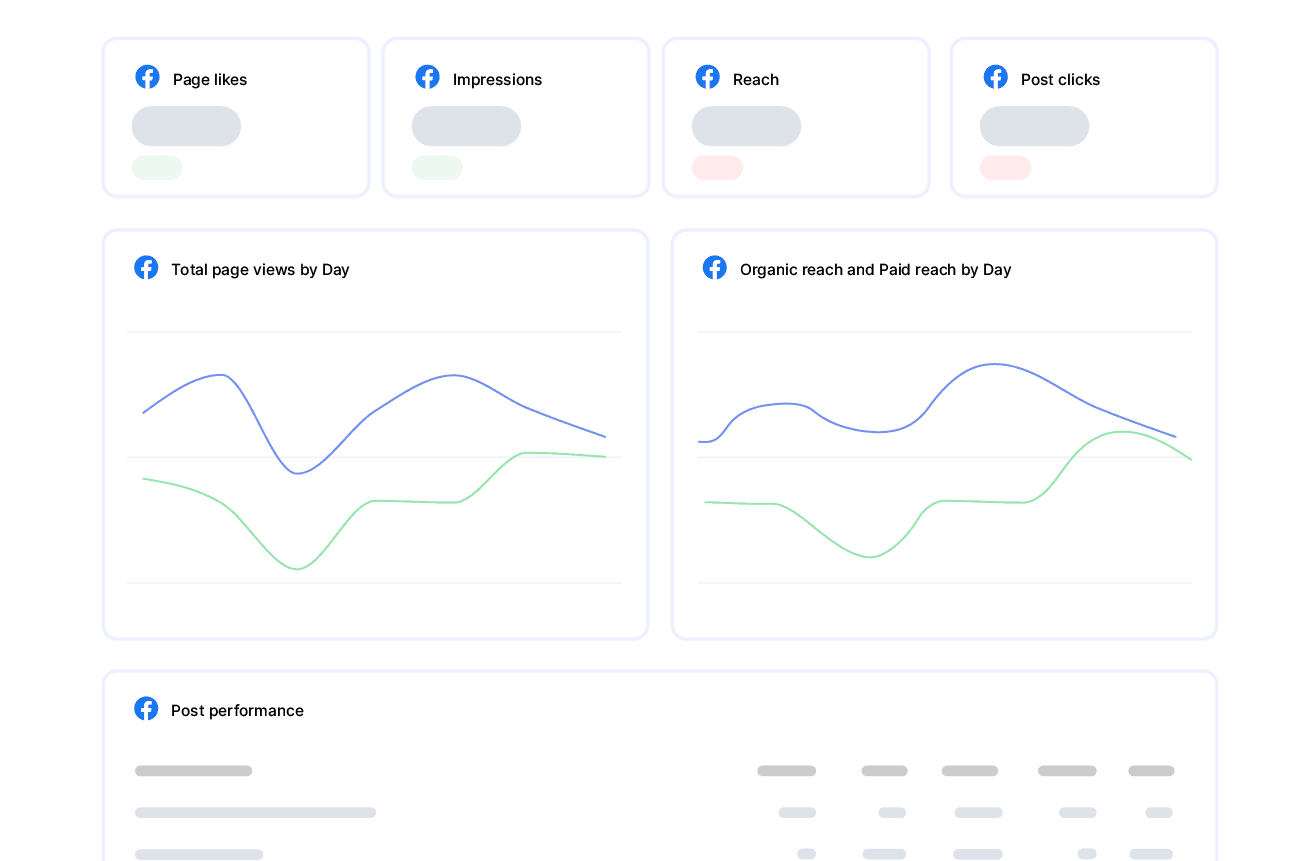
Facebook-Native
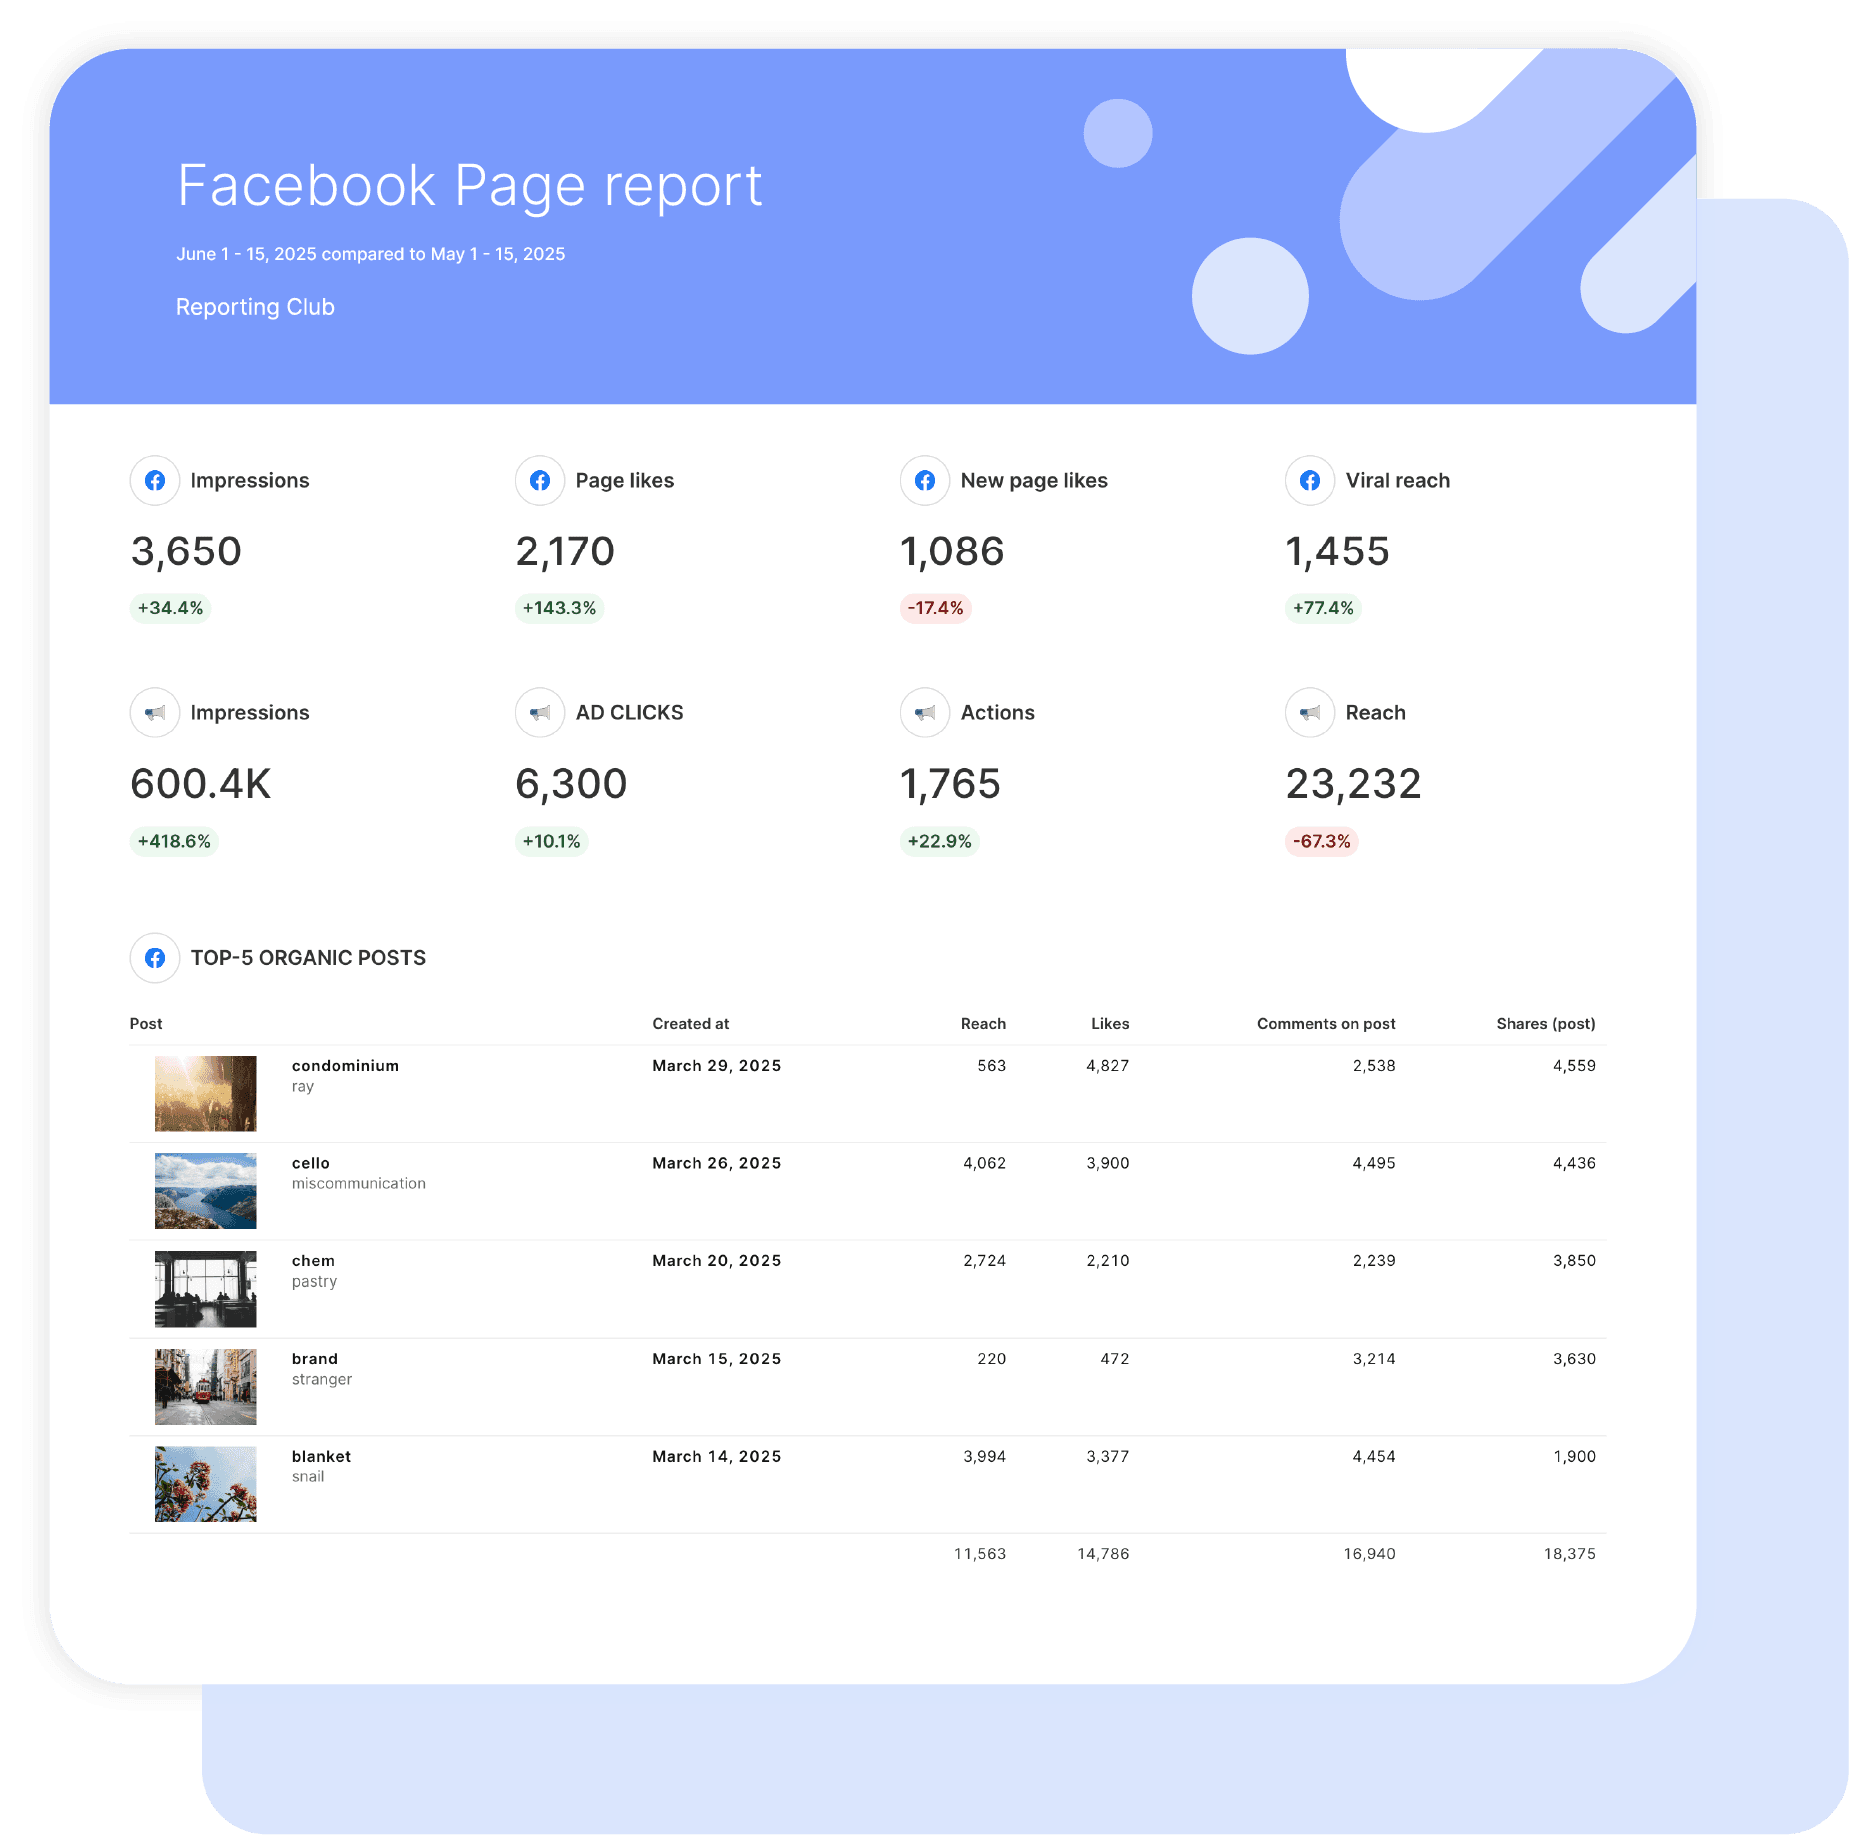
Track metrics that matter on Facebook: page engagement rates, video completion rates, organic reach performance, and audience growth. No generic social media metrics—just Facebook expertise.

Social Platform Focus
Facebook isn’t LinkedIn. Our template highlights community engagement success, B2C interaction patterns, and brand awareness tracking that justifies Facebook’s massive reach potential.
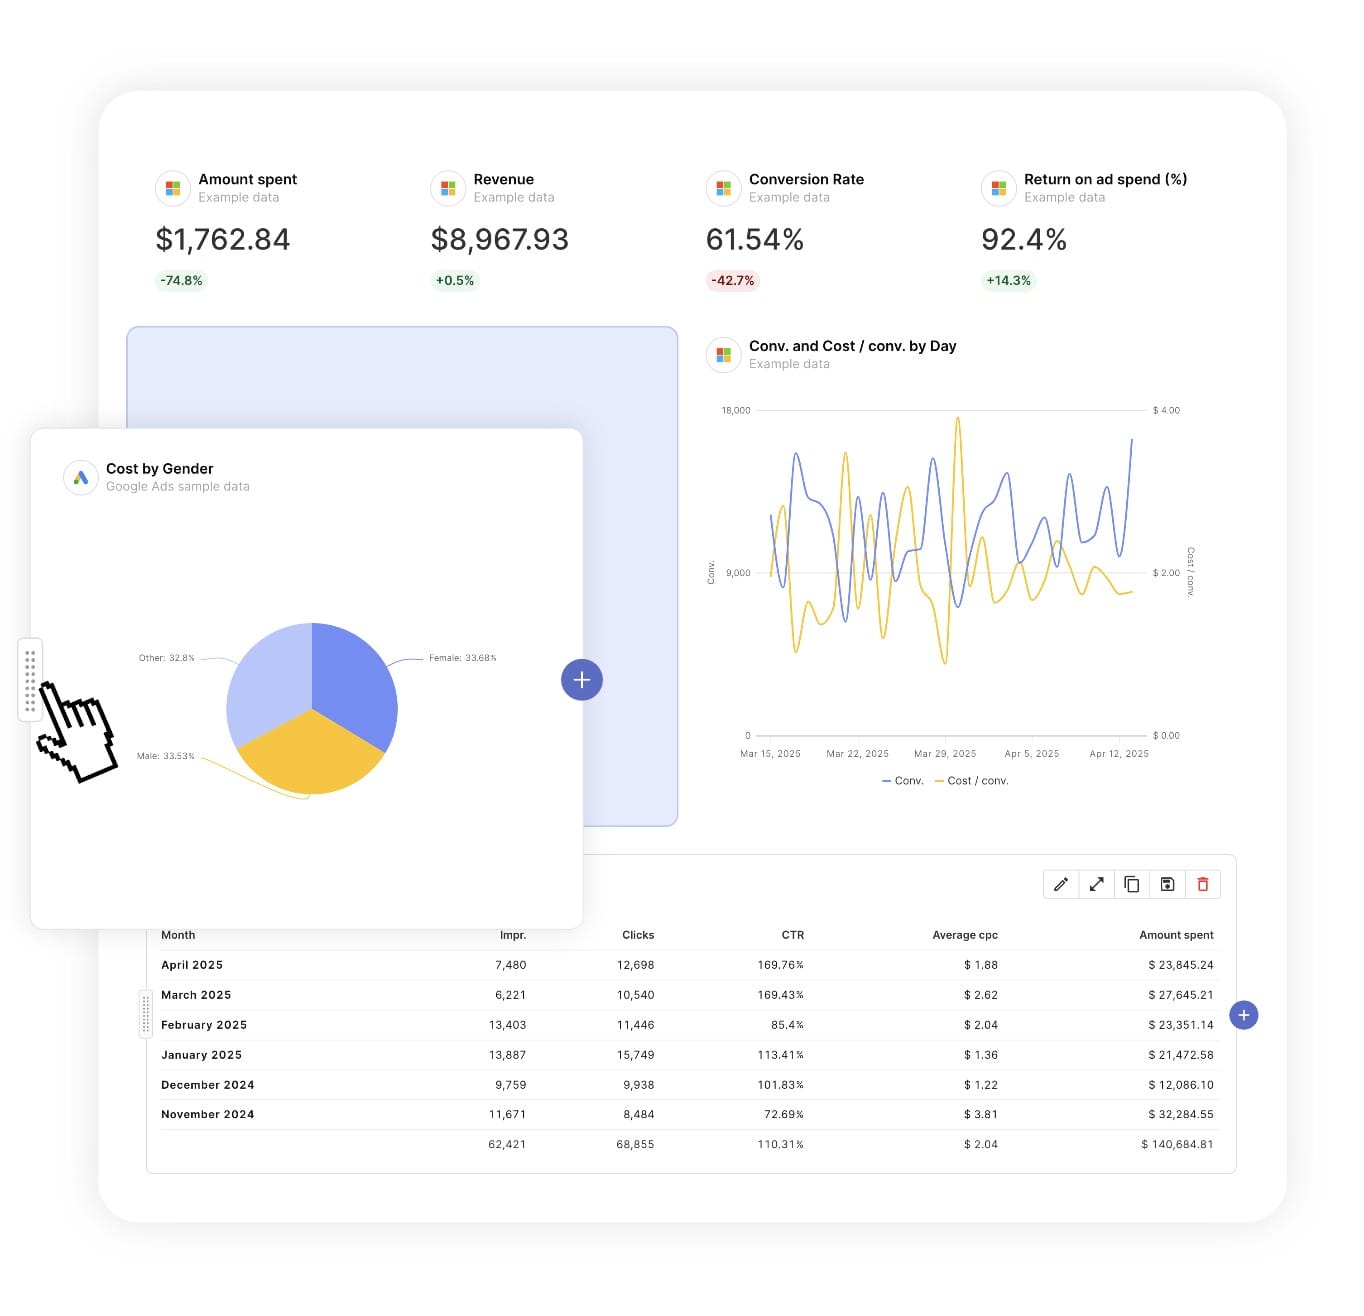
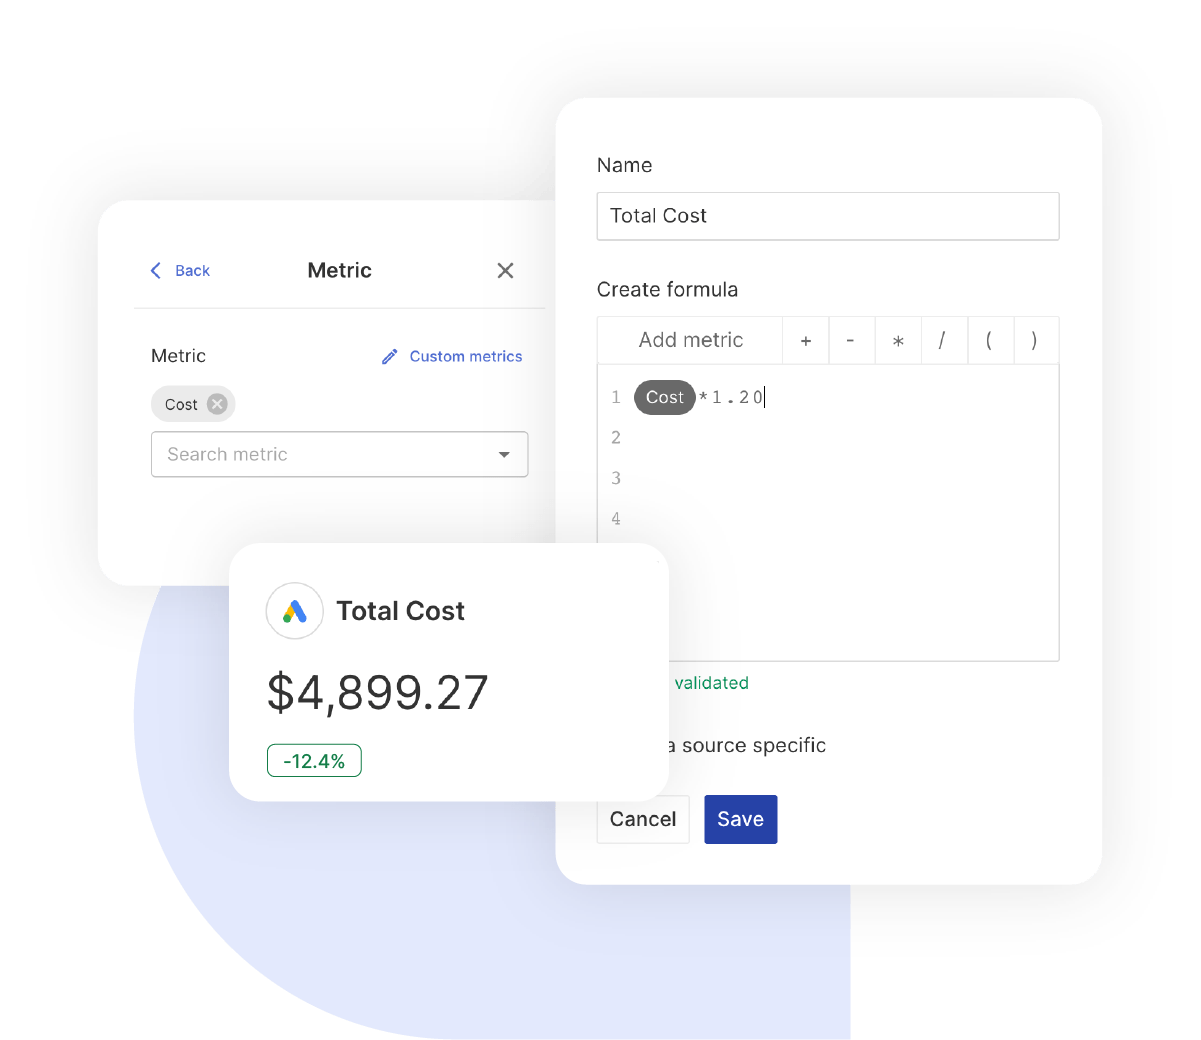
Custom Metric
Create powerful custom calculations like engagement rate per post type, video completion efficiency, and audience growth velocity. Combine any Facebook metrics to tell your unique success story.


What To Include In A Facebook Page Insights Report

Create professional Facebook Page Insights report templates that track critical metrics, deliver actionable insights, and prove social media ROI with Facebook’s comprehensive audience data.

Executive Summary With Facebook Performance Indicators

What to include in your Facebook report summary:

  • Page Engagement & Reach – Track Page Engaged Users and Page Impressions Unique for immediate impact
  • Content Performance – Post Engagement Rate and top-performing content for audience connection
  • Video Success Metrics – Video completion rates and Page Video Views Unique for content optimisation
  • Audience Growth – Page Fan Adds and follower growth rate for community building success

Perfect for stakeholder presentations and quarterly Facebook performance reviews.

Core Facebook Page Performance Metrics

Foundation metrics every Facebook Page Insights report template should track:

  • Post Engagement Rate – Audience interaction with your content compared to Facebook benchmarks
  • Page Impressions – Total brand exposure including Page Impressions Organic and Page Impressions Paid
  • Reach & Frequency – Page Impressions Unique and frequency distribution for audience coverage
  • Page Fan Growth – Page Fan Adds vs. Page Fan Removes for community building effectiveness

Essential metrics that demonstrate Facebook page health and audience engagement effectiveness.

Facebook Content Engagement Performance

What to include for content optimization insights:

  • Post Performance Analytics – Post Impressions, Post Clicks, and Post Engaged Users for content insights
  • Reaction Analysis – Post Reactions Like Total, Love, Wow, and engagement quality indicators
  • Content Format Success – Compare text posts, images, and video performance metrics
  • Viral Performance – Post Impressions Viral and organic sharing for content amplification

Show exactly which Facebook content generates the highest audience engagement and brand awareness.

Facebook Video Campaign Analytics

Video metrics for Facebook Page Insights report templates:

  • Complete Video Funnel – Page Video Views, Page Video Complete Views 30S, and retention rates
  • Engagement Quality – Video-specific likes, comments, and Post Video Social Actions
  • View Optimization – Post Video Views 10S, 15S completion rates for video campaign efficiency
  • Organic vs Paid – Page Video Views Organic vs. Page Video Views Paid performance comparison

Demonstrate Facebook video campaign success with audience engagement and completion metrics.

Page Performance Integration

Essential page data for Facebook Page Insights report templates:

  • Page Activity Analytics – Page Views Total, Page Content Activity, and mobile engagement tracking
  • Audience Growth – Page Fans growth trends and Page Fans Online Per Day engagement timing
  • Action Tracking – Page CTA Clicks, Page Website Clicks, and Page Call Phone Clicks conversion
  • Brand Interaction – Page Places Checkin and location-based engagement for local businesses

Show how Facebook content drives page engagement and brand awareness beyond post metrics.

Audience Engagement Intelligence

Social engagement performance metrics to include:

  • Engagement Quality – Page Engaged Users and meaningful interactions beyond basic likes
  • Content Format Performance – Compare image posts, video posts, and text engagement rates
  • Community Growth – Track Page Fan Adds and audience quality metrics
  • Negative Feedback – Page Negative Feedback monitoring and reputation management insights

Leverage Facebook’s social environment to show quality engagement beyond basic vanity metrics.

Campaign Budget & Performance Efficiency

Performance accountability metrics to include:

  • Organic Performance – Page Impressions Organic and organic reach efficiency tracking
  • Paid Performance – Page Impressions Paid and paid campaign performance comparison
  • Content ROI – Cost per engagement and content performance efficiency analysis
  • Growth Efficiency – Cost per Page Fan Add and audience acquisition optimization

Demonstrate cost-effective Facebook page management with transparent performance reporting.

Custom Facebook Metrics & Calculations

Powerful custom metrics you can create:

  • True Engagement Rate – (Page Engaged Users ÷ Page Impressions Unique) for quality measurement
  • Video Completion Rate – (Page Video Complete Views 30S ÷ Page Video Views) × 100 for video optimization
  • Growth Velocity – (Page Fan Adds – Page Fan Removes) ÷ time period for net growth tracking
  • Content Amplification – (Page Impressions Viral ÷ Page Impressions Organic) for viral content success

Combine any Facebook metrics to create powerful insights unique to your client’s success story.

Strategic Recommendations & Next Steps

What every Facebook Page Insights report template needs for action:

  • Content Optimization – Improve Post Engagement Rate and reduce content that generates Page Negative Feedback
  • Audience Targeting Refinement – Optimize content timing based on Page Fans Online Per Day data
  • Video Strategy Enhancement – Increase Page Video Complete Views 30S and video completion rates
  • Growth Acceleration – Maximize Page Fan Adds while minimizing Page Fan Removes through quality content

Position your agency as Facebook marketing expert with data-driven optimization strategies.

CUSTOMIZATION

Customize Your Facebook Page Report

FiltersLeverage a variety of filters to show more specific data points to quickly identify issues and take swift action.

SchedulingAutomate and share your dashboards and reports on a schedule that best meets your needs.

White labelReflect your brand by incorporating your logo and brand colors into your reports. You can also use your domain to share and send your reports.

GoalsSet and track goals to gain insight into performance, trends and progress toward your goals.

Custom MetricCombine two metrics from the same data source to calculate an entirely new custom metric.

Multi-language reportsCreate reports for your clients in 14 available languages through our automatic and editable translation feature.

Report DesignResizable widgets allow you to adjust the presentation of KPIs, charts, tables, text, and images to focus clients on key data and insights.

Text and ImagesProvide context to clients or stakeholders through descriptive text widgets. Incorporate images, such as ad assets, to improve client communication and understanding.

Flexible Date RangesEasily compare data across different time periods. Fully control the date range of your overall reports or specific KPIs, charts, and tables to highlight trends.

See all features
Social Media Report Templates

Choose a template, connect your accounts, and deliver professional social media reports in minutes.

Connect With Your Favorite Data Sources

Easily Connect & Integrate Data in a Single Report

FAQ

Frequently Asked Questions

  • What is a Facebook Page Insights report template?

    A Facebook Page Insights report template is a pre-built report that automatically pulls audience and engagement data from Facebook. It showcases key metrics such as page engagement, content performance, video success, and audience growth… presented in a clear, professional layout optimised for stakeholder presentations and quarterly Facebook performance reviews.

  • How long does it take to set up a report?

    Setup takes 10 minutes: choose a template, connect ad accounts, and customize with your branding for a professional report.

  • Can I white-label reports with my agency's branding?

    Yes, add your logo, colors, and host reports on your domain (e.g., reports.youragency.com) for a seamless, professional client experience.

  • Which ad platforms are supported?

    Swydo integrates with 35+ platforms, including LinkedIn Ads, Facebook Ads, and Google Ads, allowing you to build consistent, multi-platform reports with real-time performance insights.

  • What's the cost after the free trial?

    Plans start at $49/month for 10 data sources, with no per-client fees. Additional sources cost $1.50–$3.50 each. Learn more.

Client testimonials

Discover Why Over 2,500 Agencies Trust Swydo


Create your free online marketing report in minutes

Free for 14 days, no credit card required, cancel at any time

Request a demo ▶ Get started