TThe seven tools in this guide run from $39 a month to $812 a month, and every one of them will build a client report your client is happy to open.
What separates them is the shape of the bill as you grow — per client, per data source, per dashboard, or per credit — and how much of the product sits behind a higher tier once you’re inside. A tool that looks cheap at five clients can cost triple at thirty. A tool that lists alerts on its pricing page can put them two plans up.
Disclosure: Swydo built this guide and Swydo is one of the seven tools reviewed below. We’ve included tools that beat us in specific use cases, named the disqualifiers honestly, including ours, and ranked everything by who it actually fits rather than by who paid us.
Here’s the order. The quick-comparison table and the short-list picks first, then the five features worth choosing on, then the seven tools with a “don’t pick this if” line for each, then side-by-side feature tables, the BI alternatives, a long FAQ, and a profile-by-profile match at the end.
TL;DR: The Best Client Reporting Software in 2026
The best client reporting software for marketing agencies in 2026 depends on agency type and size:
- Swydo — Best for PPC and multi-channel agencies that want predictable, scaling-friendly pricing with monitoring and AI built in. From $69/mo monthly or $62/mo annual (10 sources included).
- AgencyAnalytics — Best for all-around agency reporting with mature AI. From $79/mo monthly or $59/mo annual (5 clients).
- Whatagraph — Best for high-volume teams that want governed cross-channel reporting. From $812/mo, billed annually (Max plan, 50 source credits minimum). No monthly billing option.
- DashThis — Best for small agencies that want simplicity. From $54/mo monthly or $44/mo annual.
- Raven Tools — Best for SEO-focused agencies. From $49/mo monthly or $39/mo annual.
- NinjaCat — Best for enterprise agencies serving multi-location clients. Custom pricing (third-party estimates: $1,500–$3,000/mo annual contracts).
- TapClicks — Best for large agencies with complex enterprise data. Custom pricing (third-party estimates: starts ~$599/mo for Basic, scales to $1,500–$5,000+/mo for full implementations).
The cheapest agency-specific option is Raven Tools at $39/month annual. The tool with the most integrations is TapClicks at 250+ native connectors. TapClicks SmartSuite has the widest AI feature stack, followed by NinjaCat AI Agents at the enterprise tier. Swydo and Databox are the two that ship AI on every plan with a published credit allowance rather than a tier gate.
Quick Comparison: All 7 Tools at a Glance
The fastest way to see which tool fits your agency is the comparison table below. It covers who each tool is built for, starting price, free trial, integration count, and AI features.
All 7 Client Reporting Tools
Pricing in USD — scroll horizontally to compare every tool side by side
Swydo

Agency
Analytics

Whata
graph
DashThis
Raven
Tools

NinjaCat

TapClicks
Overview
Pricing & Scale
White-Label & Branding
AI & Automation
What Is Client Reporting Software?
Client reporting software is a tool that automates the collection, visualization, and white-labeled delivery of marketing campaign data to agency clients. It connects to ad platforms, analytics tools, and CRMs, pulls metrics on a schedule, applies your branding, and either emails a PDF or gives the client a live dashboard.
Client reporting software replaces the manual process of copying numbers from Google Ads, Meta Ads, GA4, and other platforms into spreadsheets or slide decks at the end of every reporting cycle. Agencies typically save 10–20 hours per week by switching from manual reporting to a specialized tool.
How Much Could Your Agency Save?
Drag the sliders to see your monthly time and labor savings
Time saved per month
24 hrs
Based on 80% automation of manual work
Labor cost saved per month
$1,440
Hours saved × hourly rate
Payback period
~1 day
vs $69/mo Swydo base plan
Estimates assume monthly reporting cadence and 80% of manual work automated by a specialized reporting tool. Industry benchmark: agencies typically save 10 to 20 hours per week after switching.
What Should Agencies Look for in Client Reporting Software in 2026?
Five features matter more than the rest in 2026: AI features, pricing model, integration depth, white-label and client portal capabilities, and goal tracking with alerts. The order below reflects how often each one turns out to be the deciding factor.
AI Features
Four AI features matter most in client reporting software: generative report summaries, conversational data queries, anomaly detection, and predictive forecasting. TapClicks SmartSuite and NinjaCat AI Agents lead at the enterprise tier. At the mid-market level, Swydo AI, AgencyAnalytics Ask AI, and Databox AI Analyst ship comparable capabilities, so pick on pricing model and integration fit rather than on AI marketing copy. Whatagraph IQ sits in the same functional bracket at a $812/mo entry price.
Where tools now differ is the meter. Swydo publishes a flat allowance — 4,000 AI credits a month on every plan, with a typical report summary costing about 95 credits — and bills anything past that only when you use it, against a spending limit you set. Databox scales credits by tier, from 50 a month on Free to 4,000 on Growth. AgencyAnalytics requires the $179/mo annual Agency plan before the useful AI switches on at all. Raven Tools and Geckoboard have no meaningful AI, which is a real disadvantage in 2026, though it’s worth being honest with yourself about whether your team will use a conversational AI layer or keep writing summaries by hand.
One feature to check before you buy: whether the AI is yours only, or whether clients can use it too. Swydo lets you switch AI on inside a shared dashboard so clients ask their own questions, with that usage drawing from the same credit pool and a smaller feature set than reports get. Most competitors keep AI on the agency side of the login.
Pricing Model
Three pricing structures dominate the category: per-client pricing (AgencyAnalytics, DashThis), per-data-source pricing (Swydo above 10 sources, Databox), and per-dashboard pricing (DashThis, Klipfolio). Price each model out on a 12-month projection before you sign, because a model that looks cheap at 5 clients can get expensive at 25, and the reverse is also true.
Per-Client vs Per-Source Pricing: The Crossover
Monthly cost on annual billing as agencies grow — assuming an average of 4 data sources per client
At 15 clients
$287 vs $349
Swydo $62/mo cheaper
At 25 clients
$467 vs $509
Swydo $42/mo cheaper
At 50 clients
$812 vs $909
Swydo $97/mo cheaper
Integration Depth
Integration count matters less than integration depth. A “Google Ads integration” that only pulls campaign-level data is useless for keyword reporting. NinjaCat (150+) and TapClicks (250+ native) win on count, AgencyAnalytics (80+) wins on agency-relevant breadth, and Swydo (38+ and growing) wins on depth per source for the platforms it covers, with Google Sheets, Microsoft Excel, and Manual KPIs as fallbacks for offline data or platforms without a native connector.
Integration Count Comparison
Native data connectors available across the 7 specialized client reporting tools
White-Label and Client Portal
All seven specialized tools support white-labeling. The differences sit in the polish: custom domain (Swydo, AgencyAnalytics, NinjaCat, TapClicks, DashThis on Professional+, Whatagraph as a paid add-on on Prime only), custom email sender (most tools), and full removal of vendor branding from client-facing dashboards (varies by plan tier).
Convincing white-label reporting needs logos, cover pages, brand colors, a custom email domain, and dashboard branding, and most tools in this category gate at least one of those behind a higher tier.
The portal question is separate from the branding question. A portal is one link per client that holds everything they’re allowed to see, so nobody hunts through email for the right URL. Ask what happens at your agency on the 18th of the month: if clients currently email you asking for a number, a portal is what stops that.
Goal Tracking and Alerts
Real-time goal alerts get skipped in most buying processes and then get missed every month afterward. When a client’s CPA breaks the goal, you want a Slack ping that day, not a discovery email three weeks later. Swydo, AgencyAnalytics (Agency tier), NinjaCat, TapClicks, and Whatagraph all support real-time alerts.
DashThis and Raven Tools are weaker here. If you bill on performance, this category is non-negotiable, and it ties directly to the client reporting best practices that separate agencies who keep retainers from agencies who lose them. It’s also the line between monitoring vs reporting — a report tells the client what happened, monitoring tells you while you can still fix it.
The 7 Best Client Reporting Software Tools for Marketing Agencies
Each tool below is the best fit for a specific agency type. The “Don’t pick this if” disqualifier in each section names the agencies a tool is wrong for. All prices in USD, verified on each vendor’s pricing page in May 2026.
1. Swydo— Best for PPC and Multi-Channel Agencies That Want Predictable Scaling
Per-source pricing that rewards scale, with real-time monitoring on every plan.
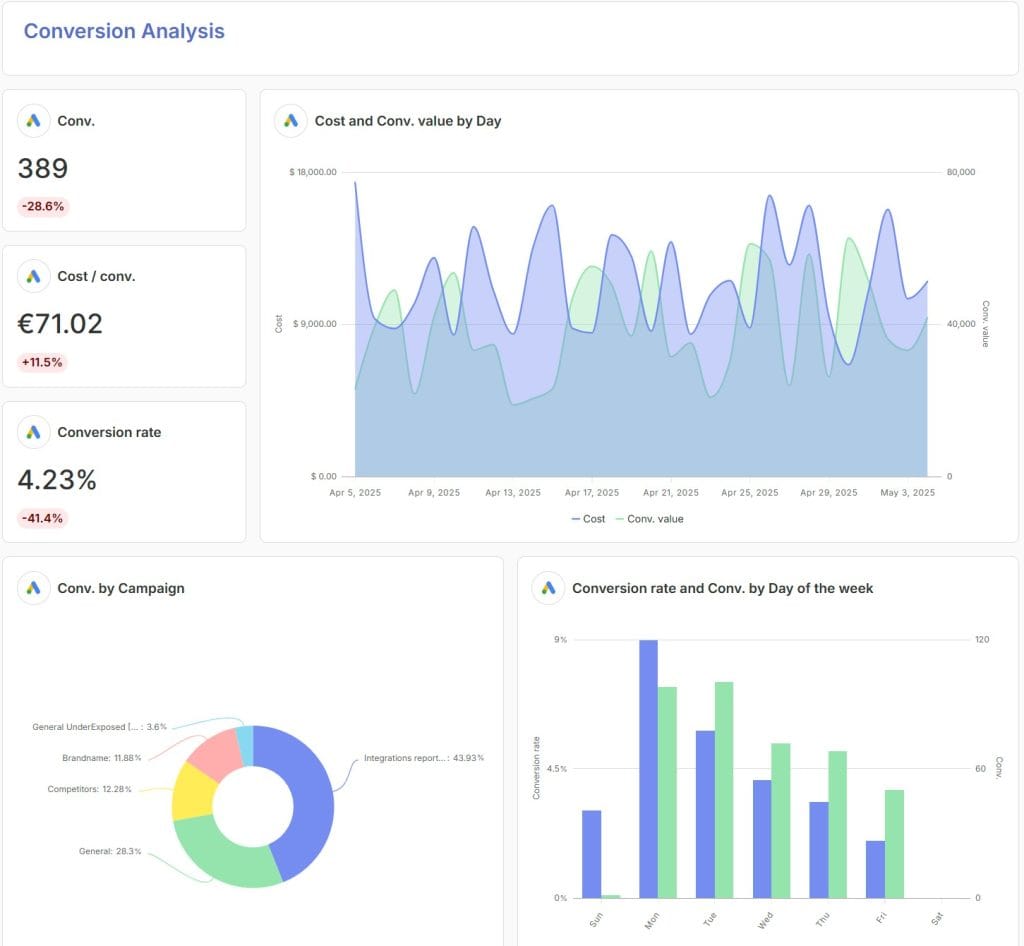
Swydo is a client reporting and monitoring platform built for marketing agencies running PPC and multi-channel campaigns at scale. It bundles three things competitors tend to split across tiers: proactive integration-failure alerts that catch broken connections before reports send, real-time goal monitoring with KPI alerts on every plan, and per-data-source pricing that drops to $2 per source above 500 sources.
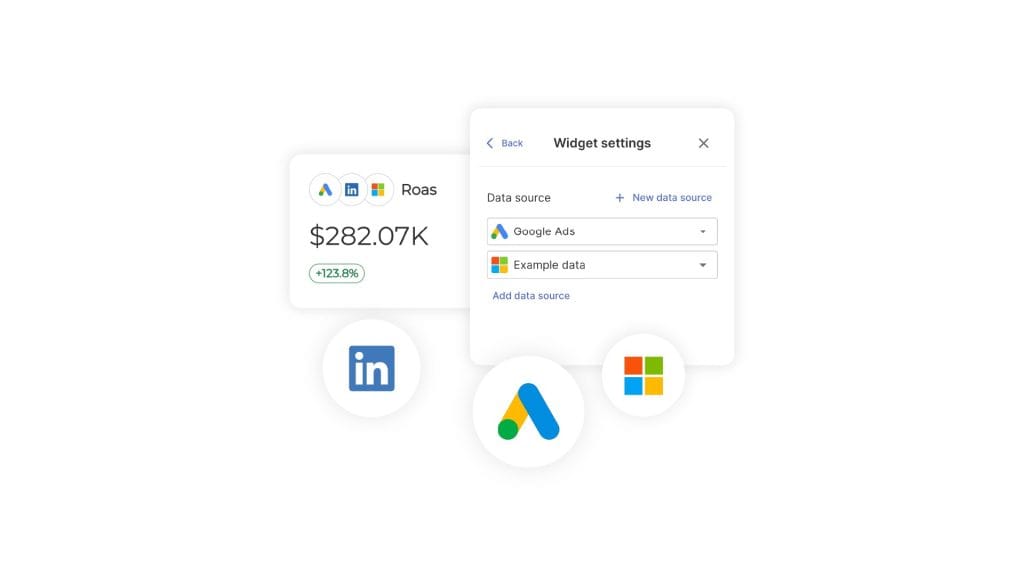
My favorite feature: Combined Data Sources. Plug in Google Ads, Meta Ads, Microsoft Ads, LinkedIn, and TikTok, then drop a single widget that shows blended Cost, Clicks, Impressions, Conversions, Revenue, and ROAS across all five. Most tools make you build five separate widgets and let the client do the math. Swydo merges them at the metric level, so a client looking at “Total Ad Spend” sees one number instead of five.
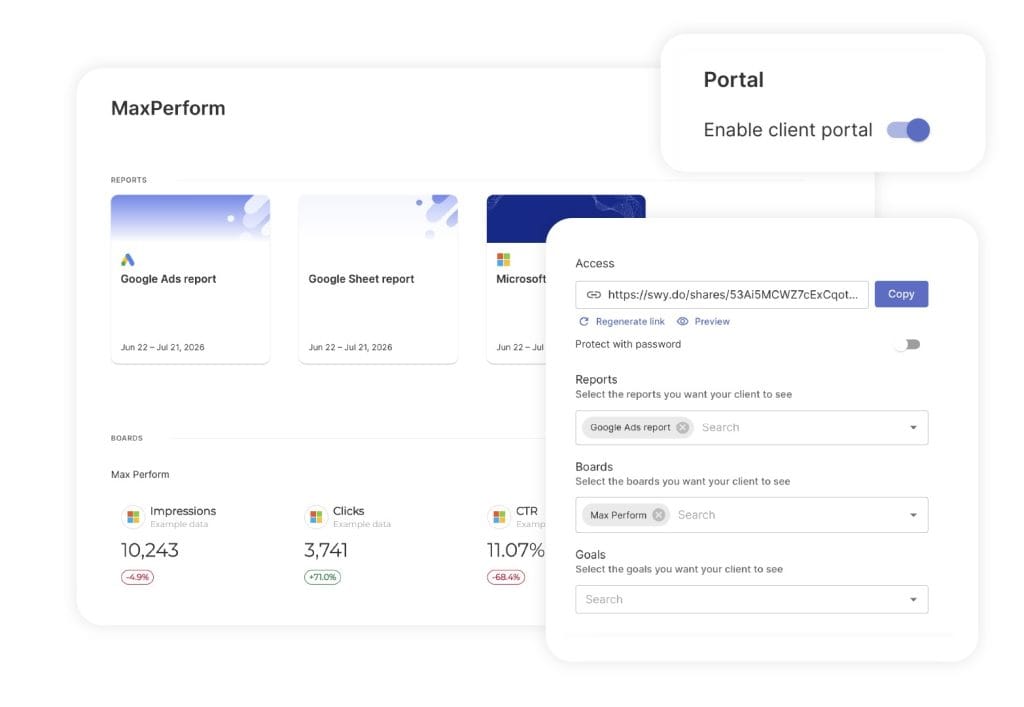
The Client Portal. Each client gets one secure link that holds their Reports, Boards, and Goals together, instead of three URLs they have to keep track of. Open the client’s account, go to the Portal tab, switch it on, and pick exactly which reports, boards, and goals they can see — a detailed monthly report, a board with the KPIs they check weekly, and the goals they’re pacing against, all in one place.
Preview it before you send so you know what they’ll land on. Add a password when the client sits in a regulated industry. Regenerate the link whenever staff turnover leaves a live dashboard bookmarked on someone’s old laptop, and the previous link stops working immediately. Update the contents whenever the client’s reporting needs change, without issuing a new link.
AI credits, in the open. Every plan includes 4,000 AI credits a month. A typical report summary costs about 95 credits, which works out to roughly 40 summaries before the allowance is a factor. Credits reset monthly and don’t carry over. Past the allowance you set your own spending limit and get billed only for what you actually use, so a quiet month costs nothing extra.
Billing → View usage details breaks spend down by thread and by team member, so you can see which part of the team is using it and on what. You can also switch AI on for clients inside a shared dashboard so they ask their own questions instead of emailing you, which draws from the same credit pool. Dashboards get a smaller set of AI features than reports do.
Don’t pick Swydo if your stack depends on a niche platform Swydo doesn’t natively integrate with and Google Sheets piping (the standard workaround via Zapier or Make) won’t bridge it, or you’re a 1–2 client freelancer who’d be cheaper on a per-client flat fee.
Key features:
- 40 integrations including Google Ads, GA4, Meta, LinkedIn, Microsoft Ads, TikTok, Pinterest, Snapchat, Reddit Ads, OpenAI Advertising, Toggl for time tracking, and Google Sheets or Microsoft Excel for custom data
- Combined Data Sources — merge metrics from up to 5 ad platforms into single widgets; also works inside Monitoring Boards, Goals, Alerts, and Metrics Overview, not just reports
- OpenAI Advertising (ChatGPT Ads) — native integration covering campaign, ad group, and ad-level data with impressions, clicks, cost, CPC, CTR, CPM, plus ad previews and a preset report template
- Swydo AI — built-in reporting assistant with conversational natural-language prompts (“What are the main wins and issues this month?”), one-click default actions (Summary, Wins, Issues, Recommendations), section-level and widget-level targeting for focused insights, and multilingual output (English, Dutch, French, German, Spanish). 4,000 credits per month included on every plan (~95 credits per typical report). AI summaries can also be inserted into scheduled report emails so every recurring send arrives with a fresh, contextual summary on top.
- Report Revision History — undo button for reports with up to 100 revisions stored per report (1-hour window); restore prior versions of widgets, KPIs, text, and sections
- Goals with On Track / Off Track / Achieved states calculated against a target glide path
- Monitoring Boards with email notifications when a tracked target turns red or green
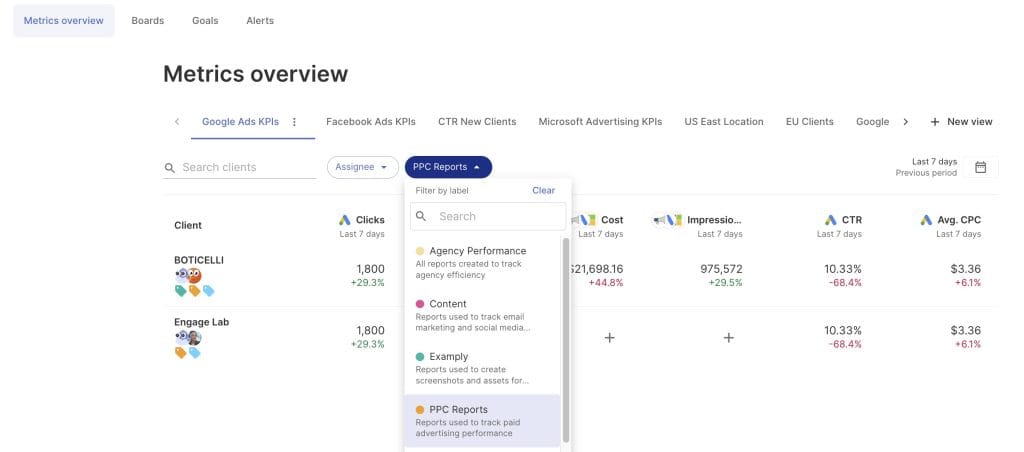
- Metrics Overview — cross-client view showing up to 6 KPIs across every client at once
- Data Source Health Check Alerts — proactive warnings when integrations break, before reports send
- Brand Templates — reusable visual styles (colors, fonts, report cover, comparison palette)
- Report Templates with linked reports — change a template once and every linked client report updates automatically
- Custom Metrics built directly inside widget settings, so a formula like “Cost × 1.20” gets created without leaving the report and saves once for reuse across every client on the same integration
- Manual KPIs, Google Sheets, and Microsoft Excel (Business accounts) for offline or unsupported data
- Toggl integration for billable time, non-billable time, billable amounts, and productivity metrics reported alongside campaign results
- White-label with custom domain (e.g., reports.youragency.com) and custom email sender domain
- Client Portal — one secure link combining Reports, Boards, and Goals per client, with optional password protection and link regeneration to instantly revoke access when someone leaves
- Unlimited users on every plan with role-based access
- Multilingual reporting and AI output (Dutch, English, French, German, Spanish, and more)
- Agentic Reporting — build and edit reports through conversation rather than menus. AI Report Builder generates a full report structure from one prompt, AI Widget Creation adds KPIs, tables, and charts in natural language, AI Widget Editing changes date ranges, chart types, metrics, and sorting by describing the change, AI Section Management creates, renames, moves, and organizes sections through conversation, AI Suggestions recommends additional widgets, and Saved Prompts stores your best prompts for reuse across future reports
Sidenote. A “data source” in Swydo’s pricing is each individual property — one Google Analytics connection with three website properties counts as three sources. A 50-client agency averaging 4 sources per client (200 sources) pays approximately $767/mo on annual billing.
Pros:
- Proactive integration-failure alerts before reports send, which no other tool in this lineup offers
- Volume pricing favors agencies with 100+ data sources
- Real-time monitoring and goal alerts on every plan, not gated to higher tiers
- Unlimited clients, unlimited users, unlimited reports on every plan
- AI credits included on every plan, billed past the allowance only when used, against a spending limit you set
- Client-facing AI inside shared dashboards, so clients answer their own “why did this drop” questions
- One portal link per client covering reports, boards, and goals, with instant link revocation
- Auto-height toggle and landscape orientation for clean PDF exports, fitting up to 6 KPIs across an A4 page
- Human support rather than chatbot deflection — accredited specialists handle every ticket, with replies within minutes during business hours
- Native ChatGPT Ads reporting, currently the only OpenAI Advertising connector in this lineup
- Prompt-to-report building from $69/mo, a capability Whatagraph gates behind an $812/mo annual-only floor
Cons:
- 38+ integrations is fewer than AgencyAnalytics (80+) or NinjaCat (150+)
- Swydo AI doesn’t support cross-report comparisons
- Client dashboards get a reduced set of AI features compared to reports
- AI credits reset monthly with no carryover, so a light month is money left on the table
- No public API (Google Sheets plus Zapier or Make is the workaround)
Pricing (USD, from swydo.com/pricing):
- Monthly billing: $69/mo base (includes 10 data sources, unlimited clients, unlimited users, unlimited reports)
- Annual billing: $62/mo base — saves 10%
- Volume tiers above 10 sources, same on monthly and annual: 11–100 sources at $4.50/source · 101–500 at $3.00/source · 501+ at $2.00/source
- AI: 4,000 credits/month included on every plan; usage past that billed only when used, capped by your own spending limit
- Free trial: 14 days, no credit card required
- Pause subscription: $10/mo preserves all reports, clients, and data sources for seasonal agencies
Further reading: How Swydo’s per-source pricing compares to per-client models
2. AgencyAnalytics— Best for All-Around Agency Reporting With Mature AI
The widest agency feature stack — if per-client pricing fits your growth.
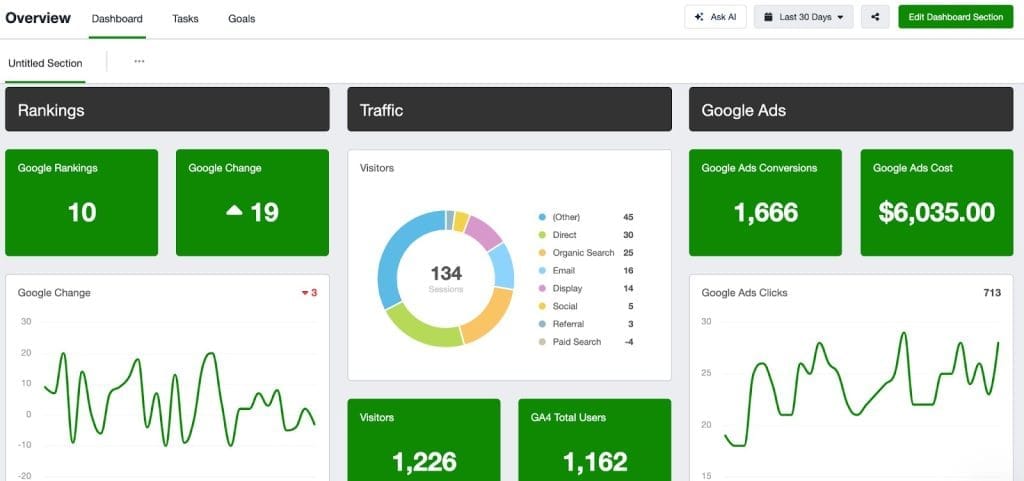
AgencyAnalytics is the most widely-deployed agency-specific reporting platform. It’s the strongest pick for agencies that want every category of feature — reporting, dashboards, SEO tools, and mature AI — in a single tool. Per-client pricing scales linearly, the most useful AI features are gated to the Agency tier and above, and the jump from Freelancer to Agency is steep.
My favorite feature: Ask AI Co-Pilot. Type “Which campaigns drove the most conversions last month?” into a dashboard and get a chart and a sentence back. It’s the closest thing in this category to talking to a junior analyst — useful when you’re producing high-volume Google Ads reporting for agencies where every account needs a quick “what changed” read. The catch — Ask AI is locked to the Agency tier and above.
Don’t pick AgencyAnalytics if you manage 50+ clients (per-client pricing punishes scale), you bill PPC management fees on a tight budget (Ad Spend Markup is gated to the Agency tier), or you only need basic reporting (DashThis is cheaper).
Key features:
- 80+ integrations spanning PPC, SEO, social, email, ecommerce, and call tracking
- Ask AI Co-Pilot — conversational data queries (Agency plan and above)
- AI Summary with tone customization (Casual, Professional, Detailed)
- Smart Reports and Smart Dashboards — auto-generated from connected sources
- Benchmark Comparisons against industry averages (Agency Pro)
- Forecasting and Anomaly Detection (Agency Pro)
- Built-in SEO toolkit: rank tracker (paid add-on starting $50/mo for 500 keywords), backlink checker, site audit
- Ad Spend Markup for PPC management fee billing (Agency tier and above)
- Roll-up reports across multiple clients
- Task assignment for team workflows
- Client portal with custom domain (Agency tier and above)
Sidenote. The most powerful AgencyAnalytics AI features (Ask AI, AI Summary) are not available on the Freelancer plan. The Freelancer-to-Agency jump costs $120/mo on annual billing.
Pros:
- Largest set of agency-relevant integrations (80+)
- Most mature AI suite among agency-specific tools that publish their pricing
- Built-in SEO toolkit eliminates separate Ahrefs/Semrush at lower client counts
- Roll-up reports for portfolio views
- Strong client portal with custom domain on Agency tier
Cons:
- Per-client pricing gets expensive at scale ($16/client/mo annual or $20/client/mo monthly adds up)
- Freelancer plan locks out AI features
- Some users report widget failures during heavy data loads
- Forecasting and Anomaly Detection locked to Agency Pro tier
- Rank Tracker is a paid add-on, not bundled
Pricing:
- Freelancer: $79/mo monthly, $59/mo annual — 5 clients
- Agency: $239/mo monthly, $179/mo annual — 10 clients (includes Ask AI + AI Summary, Goal & Budget Tracking, Ad Spend Markup, Full Branding, unlimited users)
- Agency Pro: $479/mo monthly, $349/mo annual — 15 clients (adds Forecasting, Anomaly Detection, Benchmarking, Data Aggregation, API access)
- Enterprise: Custom pricing
- Additional clients: $20/mo monthly or $16/mo annual each
- Free trial: 14 days, no credit card required
- Money-back guarantee: 30 days
Further reading: Swydo vs AgencyAnalytics comparison
3. Whatagraph— Best for AI-Driven Cross-Channel Reporting
Every gate removed, and a price floor put in its place.
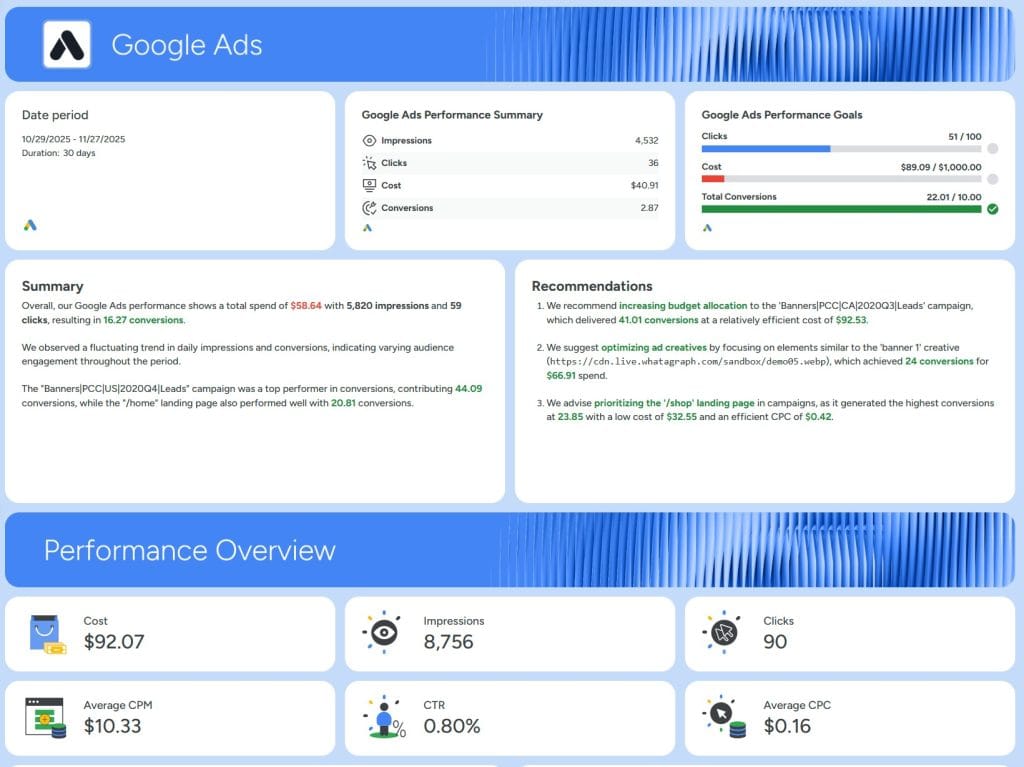
Whatagraph rebuilt its product around AI with the Whatagraph IQ suite, then rebuilt its pricing on top of it. The Free, Start, and Boost tiers are gone. Two plans remain: Max, from $812/mo billed annually with a floor of 50 source credits, and Prime, custom-priced for high-volume reporting. Neither offers monthly billing, which moves Whatagraph out of the mid-market and into NinjaCat’s range.
Most of the old gating is gone in exchange. White-label reports, KPI overviews with alerts, custom aggregations, currency exchange, and a Dedicated Success Manager all ship on Max. The trade is that a 12-source agency and a 50-source agency pay the same $812 floor, and BigQuery export, public API, SAML, and custom report domain all moved behind Prime as paid add-ons.
The connector library is split the same way. Whatagraph lists 68 integrations, and 22 of them require Prime. Max, the $812/mo plan, covers the advertising and analytics core — Google Ads, GA4, Meta, LinkedIn, TikTok, Microsoft, Amazon, Semrush, Ahrefs, OpenAI Ads. Ecommerce (Shopify, WooCommerce, BigCommerce, Magento), CRM (HubSpot, Salesforce, GoHighLevel), warehouses (BigQuery, Snowflake), programmatic (The Trade Desk, Criteo, StackAdapt, Taboola, Simpli.fi, Basis, Adform), the Google Marketing Platform stack (DV360, Campaign Manager 360, Search Ads 360), Adobe Analytics, and AdRoll all sit on Prime. If a client runs a Shopify store or a HubSpot pipeline, the published price doesn’t reach them.
My favorite feature: review-before-send on scheduled emails. Whatagraph’s automation runs every scheduled report through a manual review step — Data Gathering → Review → Ready for Sending → Sent. A reviewer gets an email when the report is ready, can roll it back to Review if something looks wrong, and the report only goes out after explicit approval. Most reporting tools fire scheduled emails on a timer with no human check, so a hallucinated AI summary or a broken integration goes straight to the client.
Don’t pick Whatagraph if your reporting budget is under $812/mo, you need monthly billing (there is none), you connect well under 50 data sources and don’t want to pay for the headroom, any client of yours runs ecommerce, CRM, warehouse, or programmatic data (those connectors are Prime-only), you need BigQuery export or public API access without moving to Prime and buying add-ons, or your AI needs are already covered by Databox AI Analyst or Swydo AI at a fraction of the annual commitment.
Key features:
- 68 connectors in total, 46 of them reachable on Max; the other 22 require Prime
- KPI Overviews with goals and alerts, included on both plans
- Whatagraph IQ+ for advanced insight generation (Prime only)
- No-code BigQuery transfer (Prime add-on) and Looker Studio transfer (Prime)
- White-label reports and custom branding on both plans; custom report domain is a Prime add-on
- Whatagraph MCP for connecting reporting data to ChatGPT, Claude, and other AI assistants
- Source Groups and Blended Sources for multi-account, multi-market clients
- Whatagraph Storage, custom aggregations, and currency exchange on both plans
- Dedicated Customer Success Manager on both plans; tailored onboarding, priority support, and enterprise SLA on Prime
- EU data center, ISO 27001, and GDPR compliance
Sidenote. Both plans include unlimited users and unlimited reports. Pricing is credit-based, where 1 credit equals 1 connected data account (one Facebook Ads account, one GA4 property), with a 50-credit floor on Max. Extra credits can be bought until you hit the next plan threshold, at which point you upgrade. The pricing page defaults to EUR at €699; toggle to USD for the $812 figure.
Pros:
- Whatagraph IQ (report creation, themes, summary, chat) on both plans with no AI-tier upsell
- Goals, alerts, white-label reports, and a Dedicated Success Manager all on the entry plan
- Clean drag-and-drop builder for non-technical users
- Funnel chart support, which is rare in agency reporting tools
- IQ Summary across 18 languages, relevant for agencies with international clients
- Native MCP server for pulling reporting data into ChatGPT or Claude
- EU data hosting with ISO 27001 certification for clients with data residency requirements
Cons:
- $812/mo entry price is the highest of any tool in this guide that publishes a rate at all
- Annual billing only, with no monthly option to test a full quarter before committing
- The 50-credit floor on Max means agencies with 20 or 30 sources pay for capacity they aren’t using
- Free plan discontinued, so there’s no zero-cost path to evaluate beyond the 14-day trial
- BigQuery transfer, public API, SAML SSO, and custom report domain are Prime add-ons
- Upgrades run through a sales call rather than self-serve, and Prime pricing is unpublished
- 46 connectors on the $812/mo Max plan, fewer than AgencyAnalytics ships at $59/mo annual
- Ecommerce, CRM, warehouse, and programmatic connectors — Shopify, HubSpot, Salesforce, BigQuery, Snowflake, The Trade Desk and 16 others — are Prime-only, and Prime has no published price
- AI features overlap heavily with Databox AI Analyst, AgencyAnalytics Ask AI, and Swydo AI, so the lead is narrower than the price gap suggests
Pricing:
- Max: $812/mo (€699/mo), billed annually — from 50 source credits, unlimited users, unlimited reports, advanced integrations, data groups and blends, white-label reports, KPI overviews with alerts, Whatagraph IQ, Dedicated Success Manager
- Prime: Custom pricing, billed annually — everything in Max plus premium integrations, Whatagraph IQ+, Looker Studio transfer, tailored onboarding, priority support, enterprise SLA
- Prime add-ons: custom report domain, public API, BigQuery transfer, SAML SSO
- Extra credits: purchasable until you reach the next plan threshold
- Monthly billing: not offered on either plan
- Free plan: discontinued
- Free trial: 14 days on Max, no credit card required
G2 Rating: 4.5 / 5
Further reading: Swydo vs Whatagraph comparison
4. DashThis— Best for Small Agencies That Want Simplicity
Lowest learning curve in the category, with caveats on customization.
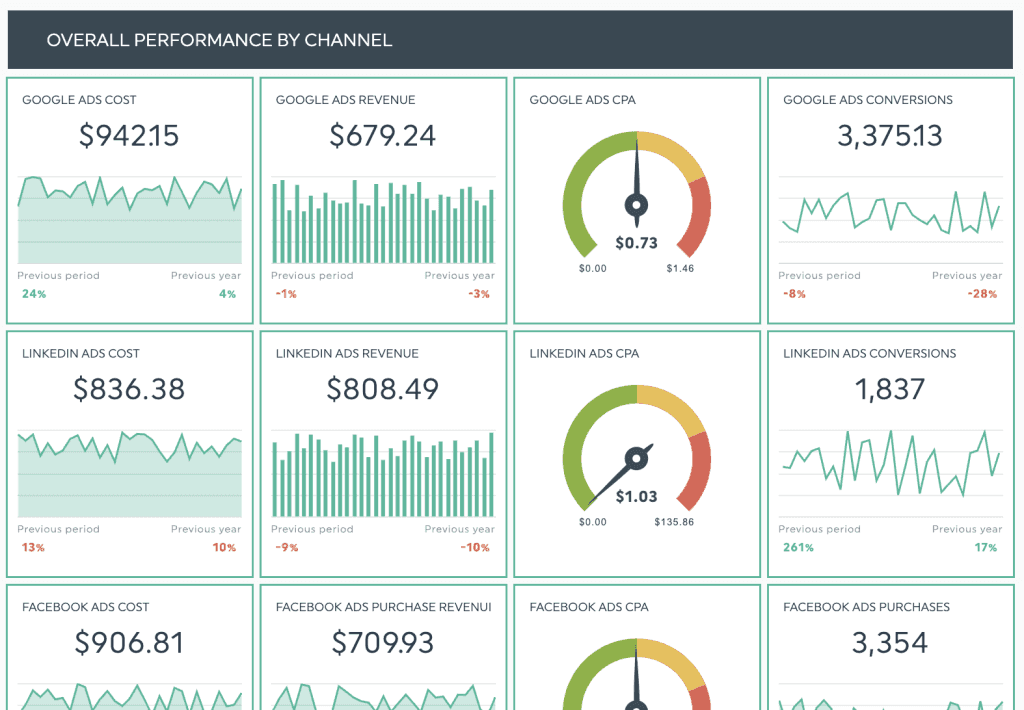
DashThis is the easiest tool to learn in the client reporting category. It has the lowest entry price among agency tools at $44/mo annual and unlimited clients on every plan. The 2026 pricing change added source-based limits that constrain multi-platform agencies, and DashThis has no public API. (For agencies sizing the two head-to-head, our Swydo vs DashThis write-up walks through which pricing model fits which agency profile.)
My favorite feature: Free AI Insights on every plan. Most competitors gate AI summaries behind upgrades. DashThis gives you four preset insights at every tier with no add-on cost. Not the deepest AI in the category — but the only one you don’t pay extra for.
Don’t pick DashThis if you need real-time monitoring with alerts, you want deep customization of report layouts, you manage clients with 10+ data sources each, or you need API access for custom workflows.
Key features:
- 30+ integrations covering core marketing platforms
- 9 widget types: Pie, Trend, Stacked Columns, Gauge, Historic, Simple Number, Multi-Column List, Year Over Year, List
- AI Insights (free, 4 preset insights: Wins, Issues, Opportunities, Summary) on every plan
- AI Insights Pro add-on (chat mode, custom dashboard context, unlimited insights): $19/mo monthly, $15/mo annual
- CSV import for non-integrated data
- Reusable dashboard templates
- Share via email, URL, or PDF
- Unlimited clients on every plan
- White-label with custom logo and colors (custom domain on Professional+)
- Basic markup options on cost-metric widgets
Sidenote. The 2026 DashThis pricing update added source-based limits alongside dashboard limits. Multi-platform agencies should verify they fit within the source caps before committing.
Pros:
- Lowest learning curve in the category
- Lowest entry price among agency tools ($44/mo annual)
- Unlimited clients on every plan
- AI Insights free on every plan
- 15-day free trial (longer than most competitors)
- 30% discount available for nonprofits
Cons:
- Limited customization compared to Swydo or AgencyAnalytics
- 9 widget types is the smallest selection among specialized tools
- Source caps added in 2026 can constrain multi-platform agencies
- AI Insights Pro is an add-on, not included
- No real-time goal alerts
- No public API
- Custom domain only on Professional and above (Individual plan ships with DashThis branding)
Pricing (USD, verified on dashthis.com/pricing — annual billing saves ~15%):
- Individual: $54/mo monthly, $44/mo annual — 3 dashboards / 15 sources
- Professional: $164/mo monthly, $139/mo annual — 10 dashboards / 40 sources (unlocks white-label, custom domain, custom email)
- Business: $324/mo monthly, $279/mo annual — 25 dashboards / 100 sources (Most Popular per DashThis)
- Standard: $499/mo monthly, $429/mo annual — 50+ dashboards / 200+ sources (configurable up to 1,500 dashboards / 6,000 sources)
- AI Insights Pro add-on: $19/mo monthly, $15/mo annual
- Free trial: 15 days
Further reading: Swydo vs DashThis comparison
5. Raven Tools— Best for SEO-Focused Agencies
The only reporting tool here that bundles a real SEO toolkit.
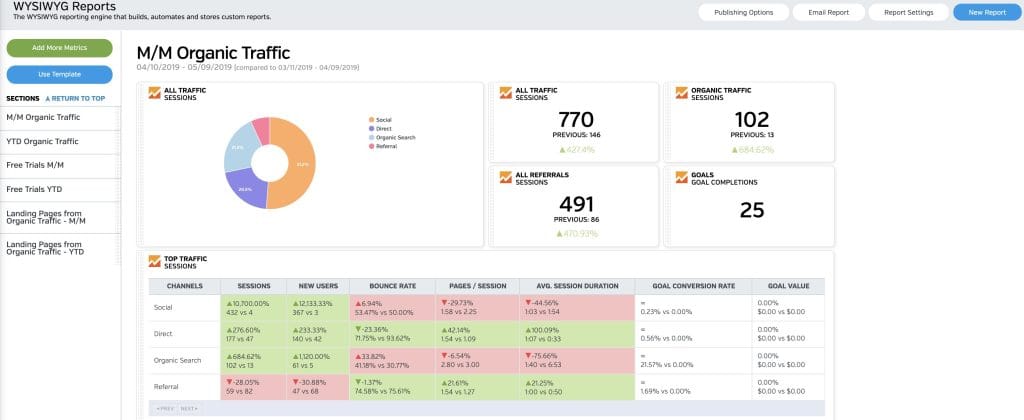
Raven Tools is the only client reporting tool in this guide that bundles a real SEO toolkit (rank tracker, backlink checker, site audit) into the same platform as the reporting. It’s owned by TapClicks and serves SEO-focused agencies. The combination saves money for SEO shops by replacing a dedicated SEO tool subscription. Outside SEO, Raven Tools is the least feature-rich tool in this lineup.
My favorite feature: Site auditor inside the report. Most agencies pay for a separate site audit tool (Screaming Frog, Sitebulb, Ahrefs Site Audit) and a separate reporting tool. Raven puts technical SEO findings inside the same client deliverable as the rank report. One subscription instead of two — and clients see the SEO audit findings alongside the wins, instead of as a separate document they have to chase.
Don’t pick Raven Tools if you serve clients across PPC, social, ecommerce, and SEO equally (you’ll outgrow Raven on the non-SEO side), you want modern AI features, or you need advanced data visualization.
Key features:
- 25+ data integrations
- Rank tracker for keyword positions (1,500–30,000 monthly checks depending on plan)
- Backlink checker with link profile analysis (Majestic data)
- Live site audit for technical SEO (50k–7M monthly page crawls depending on plan)
- Competitor research including domain analysis (Moz + Majestic data)
- Reusable report templates
- Standard chart types (bar, line, pie)
- White-label reports (full white-label on Grow and above)
Pros:
- SEO toolkit included (saves on separate SEO tool subscriptions)
- Lowest entry price among agency-specific tools ($39/mo annual)
- Domain-based pricing favors agencies with high client counts and shallow data per client
- Owned by TapClicks (stable parent company)
- Up to 30% discount on annual prepaid plans
Cons:
- Weakest AI feature set in this guide
- 25+ integrations is the smallest count
- Only basic chart types (no advanced visualizations)
- UI dated compared to Whatagraph or DashThis
- No conversational AI or generative summaries
- Annual plans are pre-paid in full (no monthly installments)
Pricing (USD, verified on raventools.com/marketing-platform/pricing):
- Small Biz: $49/mo monthly, $39/mo annual prepaid ($468/yr) — 2 domains, 2 users
- Start: $109/mo monthly, $79/mo annual prepaid ($948/yr) — 20 domains, 4 users
- Grow: $199/mo monthly, $139/mo annual prepaid ($1,668/yr) — 80 domains, 8 users (full white-label unlocks here)
- Thrive: $299/mo monthly, $249/mo annual prepaid ($2,988/yr) — 160 domains, 20 users
- Lead: $479/mo monthly, $399/mo annual prepaid ($4,788/yr) — 320 domains, 40 users
- Enterprise: Custom pricing
- Free trial: 7 days
Further reading: Best SEO reporting software for agencies
6.NinjaCat— Best for Enterprise Agencies Serving Multi-Location Clients
AI agents and managed Data Cloud for the largest agencies in the category.
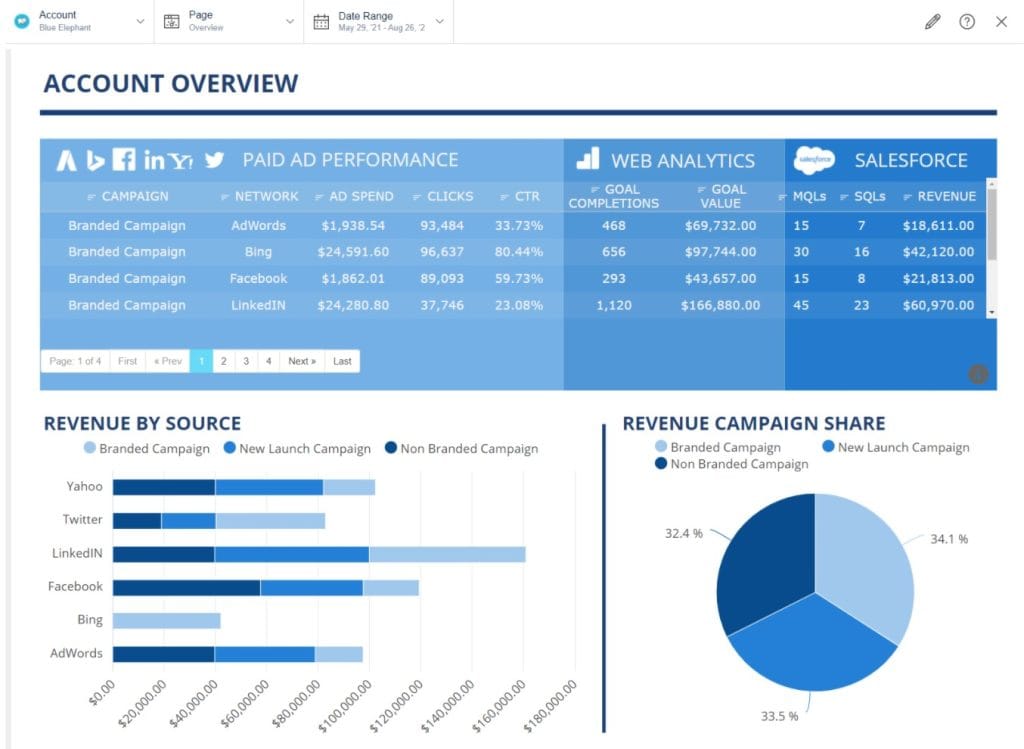
NinjaCat is built for the largest agencies in the client reporting category. It repositioned in 2025–2026 around AI agents — software workers that monitor budgets, flag campaign issues, and surface insights without being asked. NinjaCat is the most expensive tool in this lineup at typical contract sizes and pricing is not publicly listed.
My favorite feature: Pre-built AI agents library. Negative keyword discovery, search-term mining, ad copy QA, budget pacing, anomaly detection — each one is a job a junior media buyer used to do manually. The agents run on a schedule and only escalate when something needs a human. Most other tools in this guide require you to configure those workflows yourself.
Don’t pick NinjaCat if you have under 50 clients, you need monthly billing, you want to self-serve sign-up, or you don’t serve multi-location enterprise clients.
Key features:
- 150+ data integrations across advertising, analytics, call tracking, and CRM
- AI Copilot with natural language data queries
- AI Agents library — pre-built agents for budget monitoring, anomaly detection, KPI tracking, negative keyword discovery, search-term mining, and ad copy QA
- Build-Your-Own AI Agent capability
- Fully managed Data Cloud running on Snowflake with ETL and semantic data modeling
- Direct integration with BI tools (Tableau, Looker Studio) and warehouses (BigQuery, Redshift, Databricks)
- PPC markup for management fee billing
- Real-time alerts on budget pacing and KPI changes
- API access for custom integrations
- Multi-location reporting (key for franchise/QSR/healthcare clients)
- White-label client portal
Pros:
- Strongest multi-location reporting in the category
- AI agents automate work other tools require manual configuration for
- Managed Data Cloud removes the need for separate ETL tools
- 150+ integrations covers most enterprise marketing stacks
- SOC 2 Type II certified, customer data never used to train models
Cons:
- Most expensive option in the lineup
- Annual contracts only
- No free trial — demo-and-quote sales process
- Steeper learning curve than agency-specific tools
- Overkill for agencies under 50 clients
- Pricing not published — must request a quote
Pricing (NinjaCat does not publish pricing publicly — figures below are aggregated third-party estimates from G2, SoftwareSuggest, Improvado, and ITQlick as of 2025–2026):
- Industry-reported starting range: $1,500–$3,000/mo on annual contracts
- Some sources cite: $3,000+ per contract (annual)
- Implementation fees (third-party estimates): $500–$2,000 for SMBs (4–6 weeks), $3,000–$10,000 for enterprise (8–12 weeks)
- Free trial: None; demo only
7. TapClicks— Best for Large Agencies With Complex Enterprise Data
The broadest data integration footprint in the category, plus the deepest AI stack.
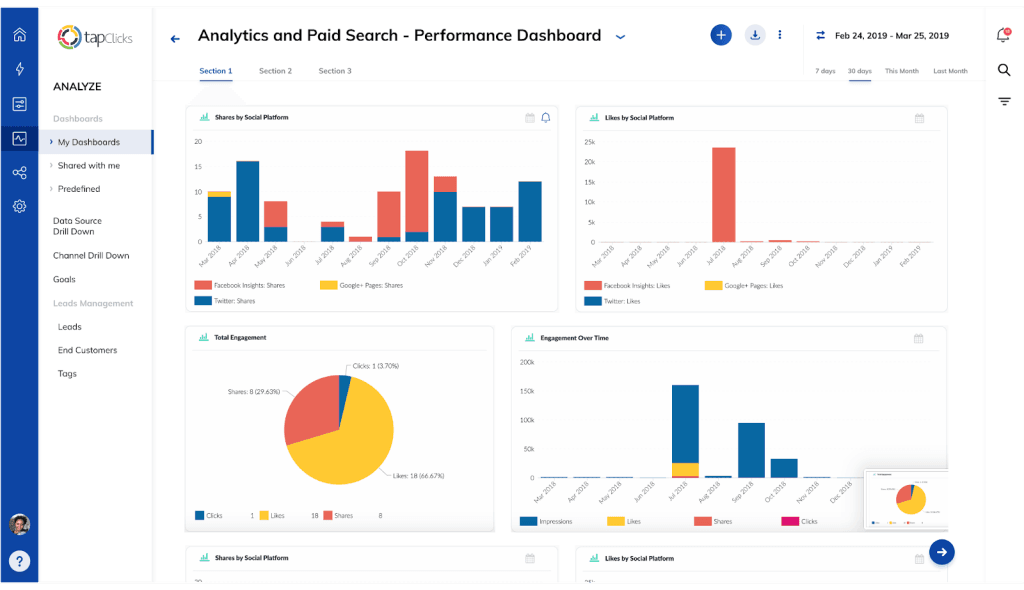
TapClicks rebuilt its product around AI in 2026 with the TapAI / SmartSuite stack. It offers the broadest enterprise data integration in the category with 250+ native connectors plus SmartConnector for any source not in the library. Pricing is opaque (quote-based), the interface has a learning curve, and TapClicks is overkill for most agencies under 100 clients. TapClicks owns Raven Tools and iSpionage.
My favorite feature: SmartConnector. Every reporting tool advertises its native integration count. TapClicks is the only one in this guide where “we don’t have an integration for that” essentially never applies — SmartConnector lets you build a pipeline to any source with API access. For agencies serving niche industries (legal tech, B2B SaaS verticals, regional ad networks), this matters more than a 250-vs-150 integration headline. If you’re evaluating the broader category beyond the agency-specific tools listed here, our roundup of the best report automation tools covers options outside the agency niche too.
Don’t pick TapClicks if you’re an SMB agency, you need transparent pricing before a sales call, you want to self-serve, or you don’t have data-savvy team members to leverage the AI stack.
Key features:
- 250+ native data connectors plus SmartConnector for any source not in the native library
- TapAI / SmartSuite stack:
- SmartStory — narrative AI summaries and executive-ready presentations
- SmartReports — automated report generation
- SmartAnalytics — predictive insights with machine learning
- SmartSlides — AI-generated PowerPoint reports
- SmartEmail — auto-AI insights delivered via email
- AI Insights Agents by Persona — different views for CMO, MarOps, Sales
- AI Operator Agents — Data Transformation Agent for cleaning and standardizing data
- Build-Your-Own AI Agents
- TapAnalytics for in-depth marketing analysis
- iSpionage access for PPC and SEO competitor intelligence
- Customizable, automated white-label reports
- Combo charts (unique in this category)
- Direct push to Snowflake, BigQuery, Redshift, S3, Tableau, Power BI, and Looker Studio
Pros:
- Broadest data integration in the category (250+ native plus SmartConnector for anything else)
- Most extensive AI feature stack of any tool in this guide
- Includes iSpionage for competitive intelligence
- Snowflake/BigQuery integration for enterprise data warehouses
Cons:
- No public per-tier pricing (quote-only)
- Steepest learning curve in the lineup
- UI considered dated by some users
- Implementation typically requires onboarding services
- Overkill for most agencies under 100 clients
- Long-term contract lock-in reported in user reviews
Pricing (TapClicks does not publish per-tier pricing on its own pricing page in 2026 — figures below are aggregated third-party estimates from Capterra, SoftwareFinder, Tekpon, and TrustRadius):
- Basic (third-party estimates): ~$599/mo, flat-rate, monthly billing
- Pro (third-party estimates): ~$999/mo per user
- Elite: Custom pricing — contact vendor
- Industry-reported full implementations: $1,500–$5,000+/mo
- 2026 product structure: SmartStory, SmartReports, SmartAnalytics, SmartSuite tiers (all quote-based)
- Free trial: Demo only; 14-day trial available on request per some sources
- Implementation fees (third-party estimates): $1,000–$10,000
Detailed Feature Comparisons
The category-by-category tables below compare the seven specialized tools on the dimensions that change buying decisions. AI is the biggest 2026 differentiator, and the shape of the AI bill is now part of that.
Which Client Reporting Tool Has the Best AI Features?
TapClicks SmartSuite has the widest AI feature stack of any client reporting tool in 2026, with NinjaCat as the strongest enterprise-tier alternative. At the mid-market level, AgencyAnalytics Ask AI, Databox AI Analyst, and Swydo AI ship comparable capabilities, and the deciding factor is usually pricing model rather than feature depth. Whatagraph IQ matches them functionally at a $812/mo entry price. Raven Tools is the only tool in this guide without meaningful AI.
AI Features by Tool
Eleven AI capabilities that separate client reporting tools, and which platforms support each
| AI Feature | Swydo | Agency Analytics | Whata graph | Dash This | Raven Tools | Ninja Cat | Tap Clicks |
|---|---|---|---|---|---|---|---|
| Prompt-to-report building | ✓ | ✓Smart Reports | ✓ | — | — | ✓ | ✓ |
| Prompt-to-widget creating & editing | ✓ | — | Limited | — | — | Limited | Limited |
| Saved prompts for reuse | ✓ | — | — | — | — | — | — |
| Generative summaries | ✓ | ✓Agency+ | ✓ | ✓ | — | ✓ | ✓ |
| AI summaries inside scheduled emails | ✓ | — | Limited | — | — | Limited | ✓SmartEmail |
| Conversational queries | ✓ | ✓Agency+ | ✓ | ✓Pro add-on | — | ✓ | ✓ |
| Client-facing AI in dashboards | ✓ | — | — | — | — | — | — |
| Anomaly detection & alerts | ✓ | ✓Pro tier | ✓ | — | — | ✓ | ✓ |
| Predictive forecasting | — | ✓Pro tier | LimitedPrime (IQ+) | — | — | ✓ | ✓ |
| Autonomous AI agents | — | — | — | — | — | ✓ | ✓ |
| AI-generated slides | — | — | — | — | — | — | ✓ |
| AI on base plan? | Yes4,000 credits/mo | No | Yes | Yes | — | Yes | Yes |
Data Visualization Comparison
All seven client reporting tools support bar, line, pie, KPI, and table charts. The differences sit in advanced visualizations — area charts, gauges, funnels, and geospatial maps.
Data Visualization by Tool
Chart types and advanced visualizations supported across the 7 specialized client reporting tools
| Chart Type | Swydo | Agency Analytics | Whata graph | Dash This | Raven Tools | Ninja Cat | Tap Clicks |
|---|---|---|---|---|---|---|---|
| Bar / Line / Pie | ✓ | ✓ | ✓ | ✓ | ✓ | ✓ | ✓ |
| KPI widgets | ✓ | ✓ | ✓ | ✓ | ✓ | ✓ | ✓ |
| Data tables | ✓ | ✓ | ✓ | ✓ | ✓ | ✓ | ✓ |
| Area charts | ✓ | — | ✓ | — | — | ✓ | — |
| Gauge charts | — | ✓ | — | ✓ | — | — | ✓ |
| Funnel charts | — | — | ✓ | — | — | — | ✓ |
| Geospatial maps | ✓ | ✓ | — | — | — | ✓ | — |
| Blended cross-channel widgets | ✓ | ✓ | ✓ | — | — | ✓ | ✓ |
| Heatmaps | ✓with per-cell targets | — | — | — | — | Limitedno target coding | Limitedno target coding |
| Visualization score | 7/9 | 6/9 | 6/9 | 4/9 | 3/9 | 6/9 | 6/9 |
Automation, Scheduling, and Alerts Comparison
All seven tools support automated report generation, multi-client scheduling, automated email distribution, and shareable links. The differentiation sits in alerts, goal tracking, budget monitoring, and integration-failure protection.
Automation, Scheduling & Alerts by Tool
Every tool schedules a report — alerts, pacing, and integration-failure warnings are where they separate
| Feature | Swydo | Agency Analytics | Whata graph | Dash This | Raven Tools | Ninja Cat | Tap Clicks |
|---|---|---|---|---|---|---|---|
| Custom scheduling | ✓daily/weekly/monthly/custom | ✓daily/weekly/monthly | ✓daily/weekly/monthly | ✓daily/weekly/monthly | ✓daily/weekly/monthly | ✓daily/weekly/monthly/custom | ✓daily/weekly/monthly/custom |
| Real-time data updates | ✓ | ✓ | ✓ | ✓ | Partial | ✓ | ✓ |
| Automated KPI alerts | ✓ | ✓Agency+ | ✓ | — | — | ✓ | ✓ |
| Alerts delivered to Slack | ✓plus email | Limited | Limited | — | — | ✓ | ✓ |
| Goal tracking & pacing | ✓ | ✓Agency+ | ✓ | — | — | ✓ | ✓ |
| Budget monitoring | — | ✓Agency+ | — | — | — | ✓ | ✓ |
| Integration-failure alerts | ✓ | Limited | — | — | — | ✓ | ✓ |
| Automation score | 6/7 | 5/7 | 4/7 | 2/7 | 1/7 | 7/7 | 7/7 |
Collaboration and Team Features Comparison
White-labeling is universal across the seven specialized client reporting tools. Custom domains and full client portals are not.
Collaboration & Team Features by Tool
White-labeling is universal — custom domains and client portals are not
| Feature | Swydo | Agency Analytics | Whata graph | Dash This | Raven Tools | Ninja Cat | Tap Clicks |
|---|---|---|---|---|---|---|---|
| Team role assignments | ✓ | ✓ | ✓ | ✓ | ✓ | ✓ | ✓ |
| Unlimited users | ✓ | ✓Agency+ | ✓ | —per-plan caps | — | ✓ | ✓ |
| Task assignment | — | ✓ | — | — | ✓ | ✓ | ✓ |
| White-label reports | ✓ | ✓full on Agency+ | ✓ | ✓logo/colors only | ✓ | ✓ | ✓ |
| Custom domain | ✓ | ✓Agency+ | Add-onPrime only | — | ✓ | ✓ | ✓ |
| Client portal | ✓Reports + Boards + Goals | ✓Agency+ | — | — | ✓ | ✓ | ✓ |
| Password on shared links | ✓ | Login-based | Login-based | — | Login-based | ✓ | ✓ |
| Regenerate link to revoke access | ✓ | Revoke seat | Revoke seat | — | Revoke seat | Revoke seat | Revoke seat |
| Collaboration score | 7/8 | 6/8 | 3/8 | 2/8 | 5/8 | 7/8 | 7/8 |
When Should Agencies Use a General BI Tool Instead?
Agencies should use a general BI tool (Looker Studio, Tableau, Power BI, Klipfolio, Geckoboard, or Databox) when they have a dedicated data analyst, when reporting includes non-marketing data (finance, HR, operations), when enterprise clients specifically request these tools, or when they need custom data models and transformations.
For most agencies — those without a dedicated analyst, reporting primarily on marketing data, serving SMB-to-mid-market clients — agency-specific tools save 10–20 hours per week and produce more polished client deliverables out of the box.
Data Studio (Formerly Looker Studio)
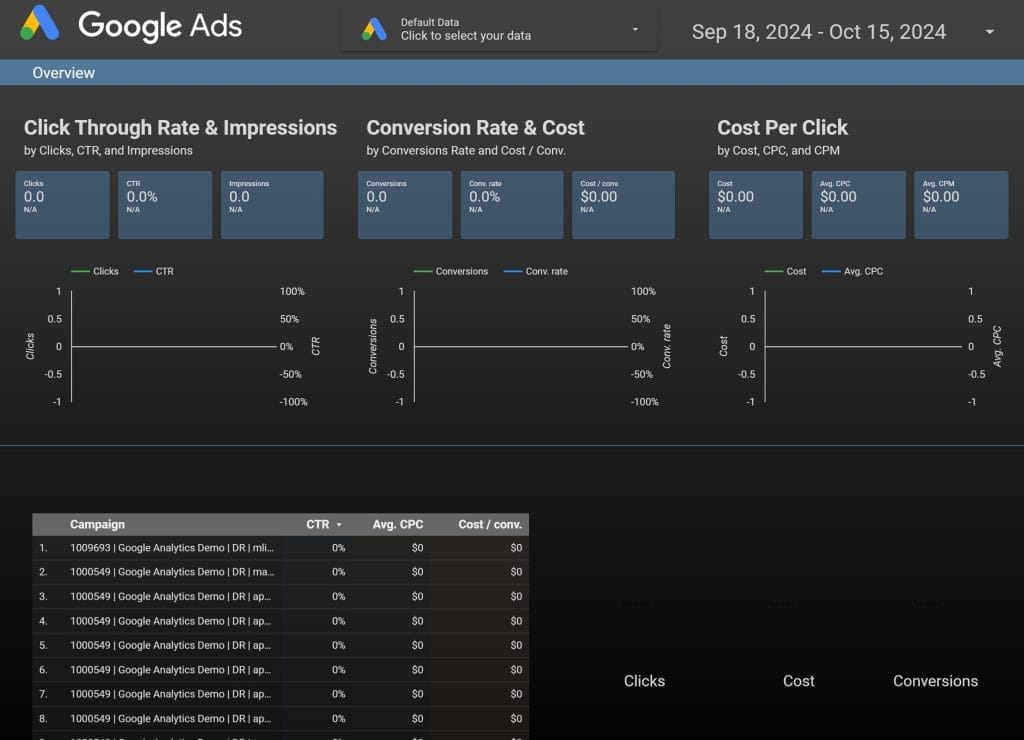
Dara Studio is Google’s free reporting tool with native integration into Google Ads, GA4, BigQuery, and Search Console. It’s the cheapest entry into client reporting if an agency has technical capability. The free tier has connector limits, performance lags, and minimal support.
Pricing: Free for Dara Studio. Data Studio Pro: $9/user/project/month annual (30-day free trial). Conversational Analytics with Gemini is free through September 30, 2026, with token-based pricing after that. For the full breakdown of free vs. Pro features and the third-party connector costs that surprise most agencies, see Swydo’s Data (Looker) Studio pricing guide.
Best for: Agencies deep in the Google ecosystem that want a free starting point.
Pros: Free; native Google integration; large library of community connectors; real-time collaboration; Pro tier adds organizational ownership and IAM/SSO compliance.
Cons: Steep learning curve for advanced features; data connections drop frequently; third-party connectors cost extra (Supermetrics, Funnel.io often $20–$500/month); limited customer support on free plan; Pro is per-user-per-project, so multi-client agencies pay for each Google Cloud project separately.
Tableau
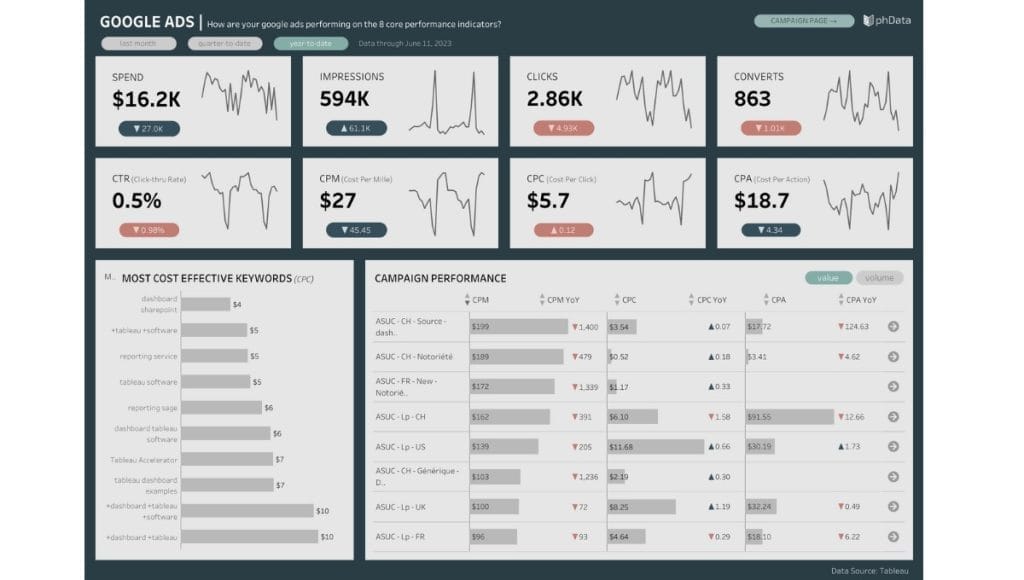
Tableau is the gold standard for advanced data visualization. Tableau is Salesforce-owned, with the strongest BI ecosystem of any tool in this guide. The 2025–2026 launches of Tableau Pulse, Tableau Agent, and Tableau Next push Tableau firmly into AI territory.
Pricing (USD, annual billing):
- Tableau Desktop Free Edition: $0 (local authoring, can’t share dashboards)
- Tableau Cloud Standard: Viewer $15/user/mo, Explorer $42/user/mo, Creator $75/user/mo
- Tableau Cloud Enterprise: Viewer $35/user/mo, Explorer $70/user/mo, Creator $115/user/mo
- Tableau+ Bundle (with Tableau Next): Custom pricing
- 14-day free trial on Creator
Best for: Agencies handling complex, large-scale data with dedicated analysts.
Pros: Most powerful visualization in this guide; strongest BI ecosystem; AI features (Pulse, Agent, Next); handles huge datasets; works with R, Python, Einstein Discovery.
Cons: Highest price for full team deployment; significant learning curve; per-user pricing punishes large teams; requires technical expertise; Tableau Desktop now only included with Creator licenses.
Power BI
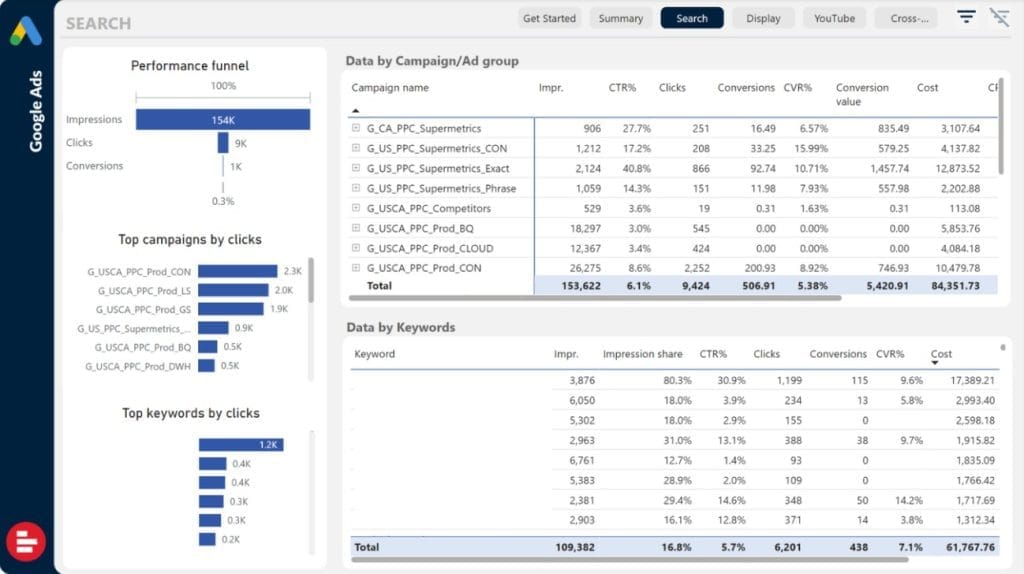
Power BI is Microsoft’s BI platform with deep Excel and Microsoft 365 integration. Power BI Copilot ships with PPU and Fabric capacity. Microsoft raised Power BI Pro from $10 to $14 per user/month and PPU from $20 to $24 per user/month effective April 1, 2025, and Microsoft Fabric replaced legacy Premium SKUs for new buyers.
Pricing (USD):
- Power BI Free: $0 (personal workspace only, can’t share)
- Power BI Pro: $14/user/month
- Power BI Premium Per User (PPU): $24/user/month
- Microsoft Fabric F64: ~$5,257/month (replaces legacy P-SKUs; bundles unlimited free viewers)
Best for: Agencies in the Microsoft ecosystem with Excel-heavy clients.
Pros: Tight Microsoft 365 integration; Power BI Copilot included with PPU and F64+; AI/ML for predictive analysis; affordable Pro tier; Fabric F64 makes economic sense above ~400 viewers.
Cons: Windows-only authoring; DAX formula language has a learning curve; pricing tiers confuse non-IT buyers; complex enterprise features locked to Fabric capacity; price increased 40% in 2025.
Coupler.io
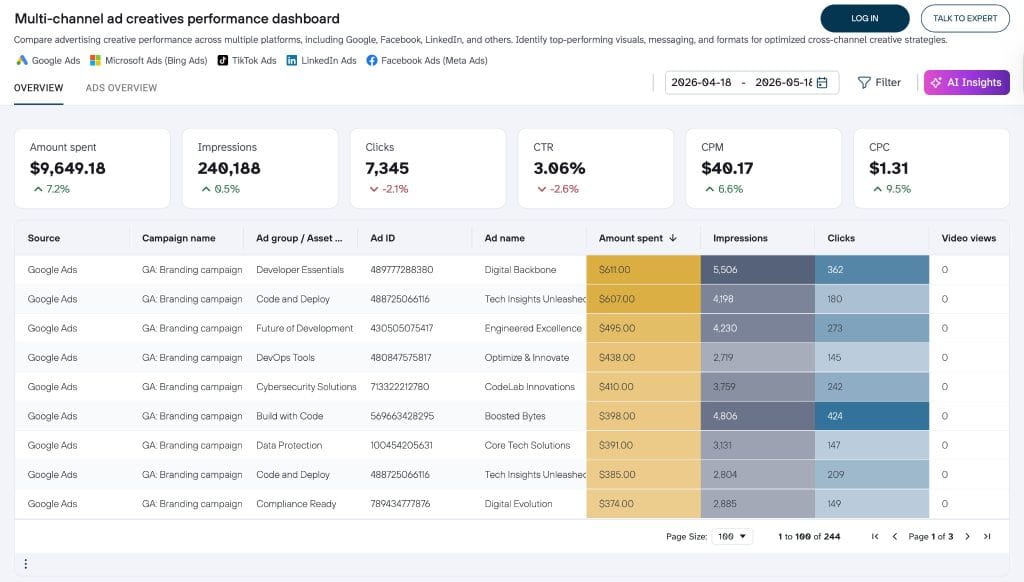
A no-code data automation platform built for agencies that wan more control over how reporting data is collected, transformed, and delivered.
Coupler.io sits somewhere between a reporting platform and a lightweight ETL tool. It helps agencies automate the movement, transformation, and analysis of marketing data across platforms like Google Ads, Meta Ads, GA4, HubSpot, Shopify, Airtable, BigQuery, Google Sheets, Excel, and Looker Studio. It expanded heavily into AI-powered reporting with integrations for ChatGPT, Claude, Gemini, Cursor, and Perplexity, plus an AI Agent for conversational analysis and business insights. It’s strongest for agencies centralizing data from multiple platforms into a single source of truth — and loses to dedicated tools like Swydo or AgencyAnalytics on built-in monitoring, KPI alerting, and client management.
My favorite feature: Data transformations before export. Most reporting connectors simply move raw data from point A to point B. Coupler.io lets agencies filter, merge, sort, calculate, and reshape datasets before they land in Google Sheets, Excel, or BI tools. For agencies combining PPC, CRM, ecommerce, and attribution data into custom dashboards, this removes a surprising amount of spreadsheet cleanup work.
Don’t pick Coupler.io if you want a polished all-in-one client reporting platform with built-in live client portals, KPI alerts, or agency-focused templates out of the box.
Pricing:
- Free plan available with limited refresh frequency
- Paid plans scale by refresh interval, row limits, and connector usage:
- Starter $24/month
- Active $99/month
- Pro $199/month
- Custom enterprise plans available for larger teams
Key features:
- 400+ integrations, including Google Ads, Meta Ads, GA4, HubSpot, Shopify, Airtable, Pipedrive, LinkedIn Ads, Microsoft Ads, and TikTok Ads
- Automated data syncing to Google Sheets, Excel, BigQuery, Looker Studio, Power BI, and other destinations
- No-code data transformations before export
- Scheduled refreshes for automated reporting workflows
- Multi-source data blending and custom calculations
- Ready-to-use dashboard templates
- Historical data imports and automatic backups
- API connector for custom sources
- AI integrations with Claude, ChatGPT, Gemini, Cursor, and Perplexity
- AI Agent for conversational analysis and business insights
- Team collaboration and shared reporting workflows
Pros: Coupler.io is more flexible than standard dashboard-only reporting tools, with strong Google Sheets and Looker Studio workflows that make it genuinely useful for agencies building custom reporting stacks. It reduces manual spreadsheet cleanup and data prep work significantly, and works well as a reporting infrastructure layer alongside BI tools.
Cons: It’s not a dedicated client reporting platform and has no built-in client portal, fewer native white-label presentation features, and requires more setup than template-first agency reporting tools. Advanced workflows may still require BI knowledge.
Klipfolio
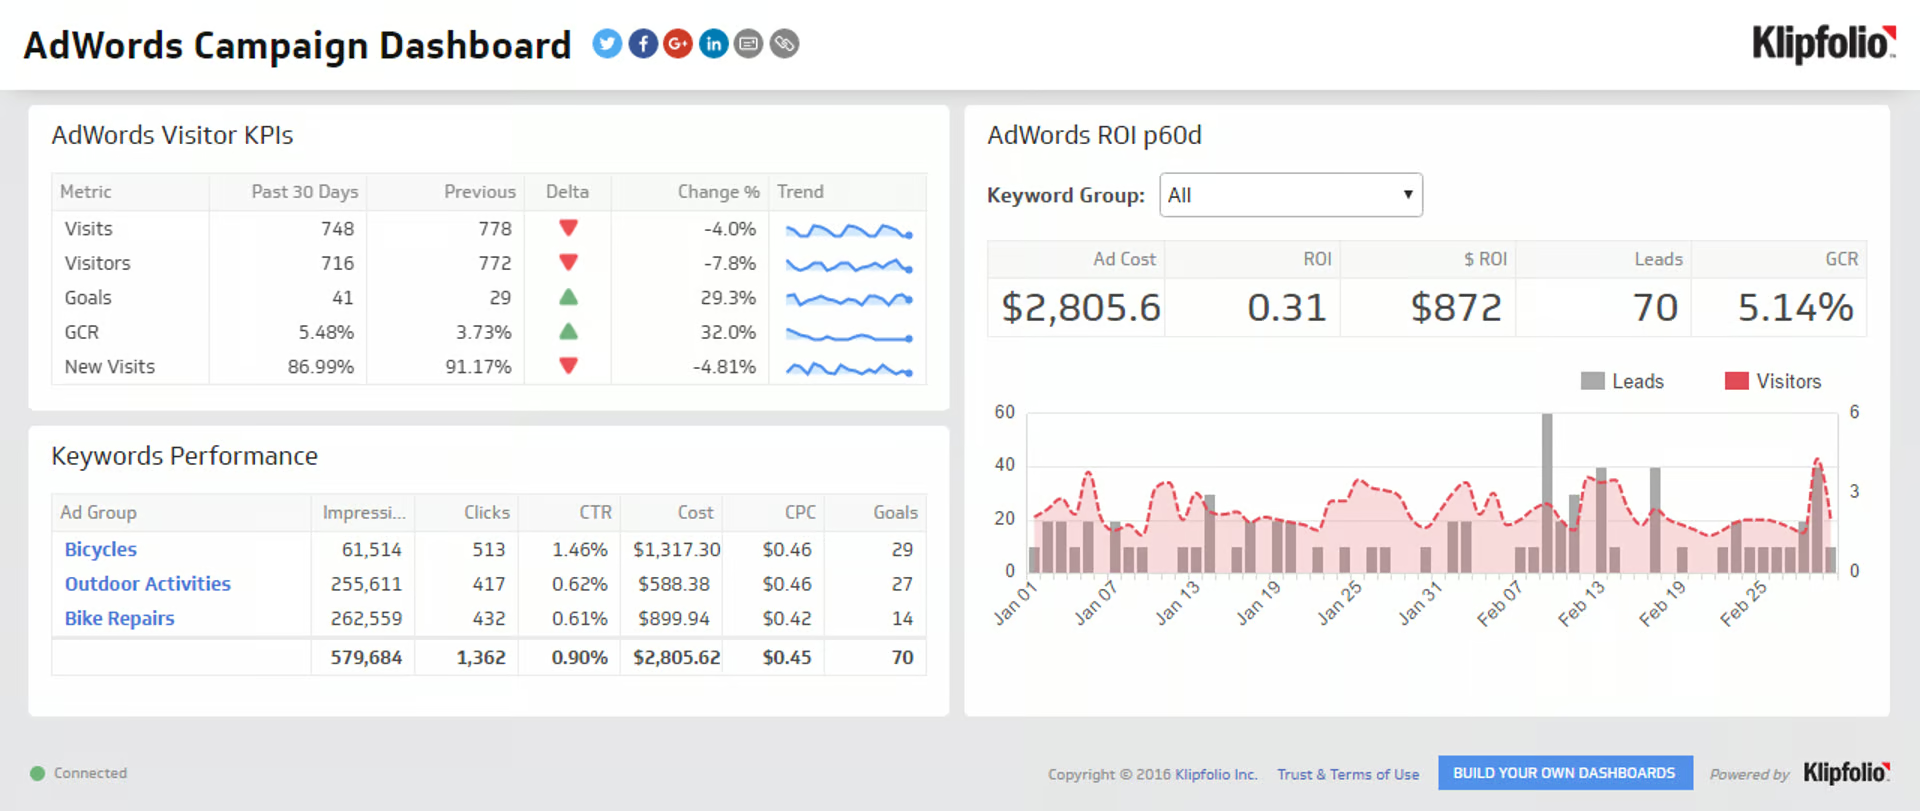
Klipfolio offers two products: Klips (custom dashboards for technical users) and PowerMetrics (metric-first product for less technical users). Klipfolio supports 130+ integrations and has a strong mobile experience.
Pricing (USD, annual billing — Klips):
- Base: $90/month — 3 dashboards, 4-hour refresh, unlimited users
- Grow: $190/month — 10 dashboards, 1-hour refresh, PDF + scheduled reports
- Team: $350/month — 20 dashboards, 15-minute refresh, SSO
- Team+: $600/month — 40 dashboards, near-real-time refresh
- 14-day free trial
White-label, custom domain, and custom CSS in Klipfolio are paid add-ons (Branding+ $199/month, custom theme $69/month, custom domain extra). AI features sit in PowerMetrics, not Klips.
Best for: Small to medium agencies wanting a balance of pre-built and custom dashboards.
Pros: Easy setup for basic dashboards; cloud-based mobile access; 130+ integrations; password-protected sharing; unlimited users on every plan.
Cons: Klips and PowerMetrics confuse buyers; advanced customization requires technical skills; pre-built templates have limited modification; latency on large datasets; white-label is a paid add-on.
Geckoboard
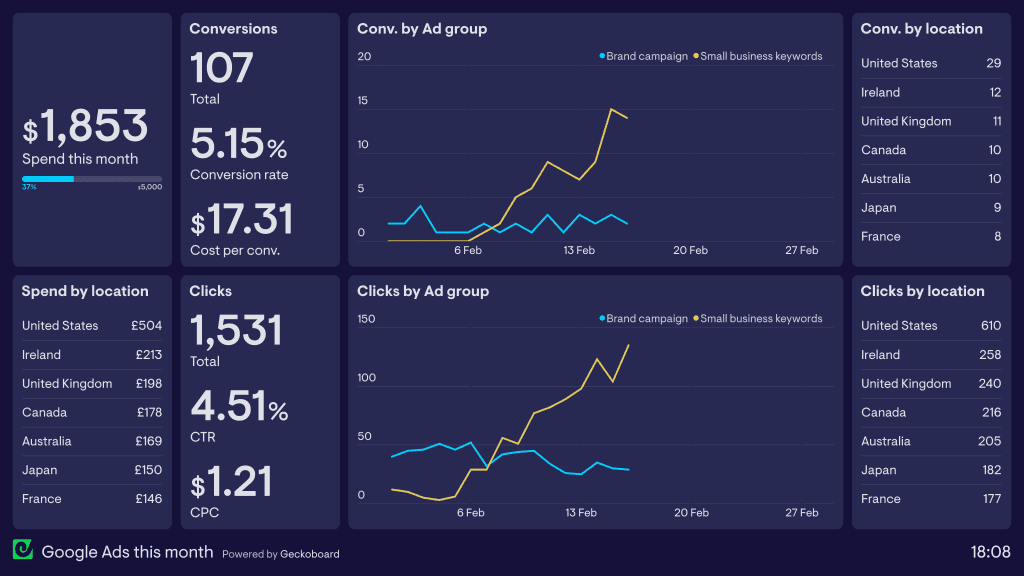
Geckoboard specializes in real-time KPI dashboards optimized for office TV displays. Geckoboard supports 90+ data sources, has no significant AI features, and offers the simplest interface in the BI category.
Pricing (USD):
- Essential: $60/month annual ($75 monthly) — 1 dashboard, 1 editor, 10 viewers
- Core: $175/month annual ($219 monthly) — 20 dashboards, 5 editors
- Pro: $319/month annual ($399 monthly) — 50 dashboards, KPI alerts to Slack/Teams, audit logs
Each extra dashboard, editor, or viewer beyond Geckoboard plan limits adds $25/month. 14-day free trial.
Best for: Agencies that want real-time KPI dashboards on office TVs and big screens.
Pros: Best real-time TV dashboard experience; simple interface; KPI notifications to Slack/Teams (Pro only); Slack and Microsoft Teams snapshot delivery.
Cons: No AI features; data refresh rates slower than competitors; white-labeling limited to logo and color theme (no custom domain); add-ons add up fast at $25/unit.
Databox
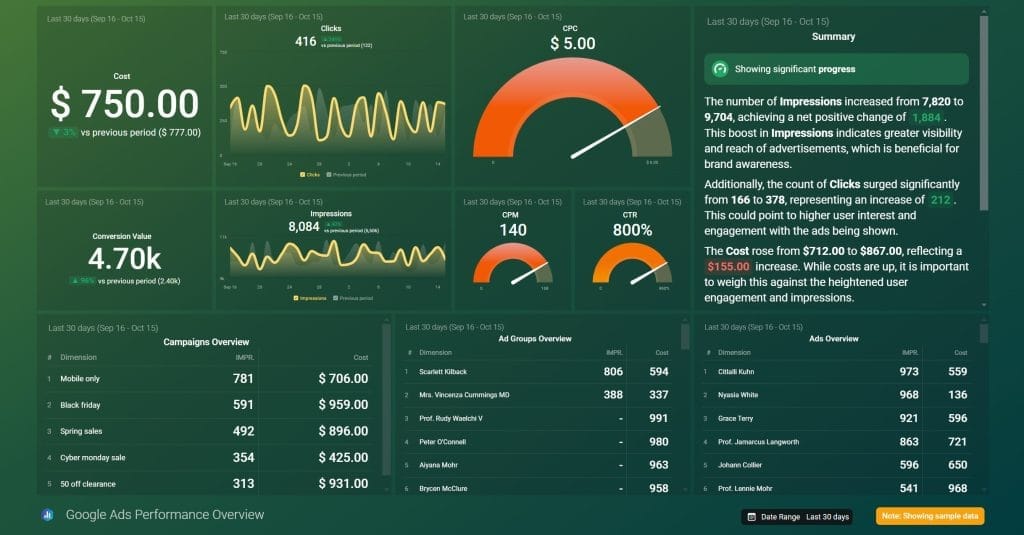
Databox added significant AI features in 2025–2026, including the Genie AI analyst, AI Performance Summaries, and an MCP server for ChatGPT/Claude, all of which ship on every plan including Free. Databox has the best mobile experience in the BI category, including Apple Watch support. The catch for agencies is white-labeling, which sits behind a $200/mo add-on or the Custom tier.
Pricing:
- Free: $0 — 3 data sources, 1 user, 1 dashboard, 50 AI credits/mo, 11 months of history, daily sync, Genie and MCP server included
- Analyst: $80/mo monthly, $64/mo annual — 5 data sources, 1 user, 500 AI credits/mo, hourly sync, anomaly detection, custom metrics
- Pro: $199/mo monthly, $159/mo annual — 3 data sources included with unlimited expansion, unlimited users, 1,500 AI credits/mo, unlimited dashboards, CSV export, Slack
- Growth: $499/mo monthly, $399/mo annual — adds forecasting, 15-minute sync, sub-accounts, unlimited history, dedicated CSM, 4,000 AI credits/mo
- Custom: Talk to sales — adds white-labeling, SSO and advanced security, account setup, priority support
- Additional data sources beyond included: $7/mo each (monthly billing) or $5.60/mo each (annual billing)
- White-labeling: $200/mo add-on on Analyst, Pro, and Growth; included on Custom
- Free trial: 14 days on the Growth plan
Best for: Small to medium agencies wanting an easy all-in-one with strong AI.
Pros: Strongest AI in the BI category; intuitive interface; excellent mobile (Apple Watch support); MCP server for ChatGPT/Claude on every plan including Free; a genuinely usable free tier with Genie included; unlimited dashboards and users from the Pro plan up; Databox Benchmarks (compare anonymized performance to similar businesses) is unique.
Cons: White-labeling is a $200/mo add-on rather than a plan feature, which is a real problem for an agency deliverable; Free and Analyst are single-user; only 3 data sources included on Pro ($159/mo annual), so most agencies upsize fast; per-source pricing climbs with multi-client portfolios; doesn’t export to BigQuery/Snowflake natively.
Client Reporting Software FAQ
Direct answers to what agencies search before they buy
Client reporting software is a tool that automates the collection, visualization, and white-labeled delivery of marketing campaign data to agency clients. It connects to ad platforms, analytics tools, and CRMs, pulls metrics on a schedule, applies your branding, and either emails a PDF or gives the client a live dashboard.
It replaces the manual process of copying numbers from Google Ads, Meta Ads, GA4, and other platforms into spreadsheets or slide decks at the end of every cycle.
Agencies typically save 10 to 20 hours per week by moving from manual reporting to a specialized tool. The savings come from automated data pulls, reusable templates, and scheduled delivery.
If you spend more than 2 hours per week building reports by hand, a specialized tool usually pays back its monthly cost within the first month.
A strong client report headlines the metric that maps to the client’s business goal, then supports it with the KPIs that explain why the number moved.
Standard sections: an executive summary, headline KPIs against goals, channel-by-channel performance, wins and issues from the period, and recommended next actions. AI summaries in tools like Swydo, AgencyAnalytics, Databox, and Whatagraph write the narrative sections for you.
Monthly is the standard cadence for most agency retainers, because it gives enough data to show real trends without the noise of daily swings. High-spend paid media accounts often add bi-weekly summaries plus always-on dashboard access for pacing visibility.
Match the cadence to the client’s decision-making cycle rather than your team’s convenience. Quarterly is too slow for active campaigns and weekly is too noisy for most retainers.
Reports are scheduled snapshots delivered as a PDF or hosted page on a fixed cadence. Dashboards are live, interactive views clients open on demand. All seven specialized tools support both formats.
Executives tend to prefer scheduled PDFs they can forward. In-house marketing teams tend to prefer live dashboards they can drill into. Agencies offering both — a monthly PDF plus an always-on dashboard — tend to retain clients longer.
Client reporting software is built for agencies delivering marketing reports to clients. BI tools (Looker Studio, Tableau, Power BI) are built for data analysts working with any kind of data. Reporting software ships with marketing integrations, white-label, client portals, and reusable templates out of the box, and BI tools require you to build most of that yourself.
Use a BI tool if you have a dedicated analyst, need to combine marketing with finance or operations data, or have an enterprise client who specifically asks for Tableau or Power BI.
Not effectively. Project management tools are built for internal team workflows rather than polished, white-labeled marketing reports. Their dashboards focus on task status and project velocity, which clients rarely care about.
Marketing agencies need a dedicated reporting tool that pulls from ad platforms and analytics tools, not a project management platform stretched sideways into reporting.
Yes if you spend more than 2 hours per week on reports, manage 3 or more clients, or pay for third-party connectors like Supermetrics or Funnel.io. Below that threshold, a Looker Studio template or even a Google Sheets dashboard can be enough.
The other forcing functions: needing white-label deliverables, wanting real-time alerts on campaign performance, or having lost dashboards because employees left and took the knowledge with them.
The right choice depends on agency size, channel mix, and pricing model fit. Swydo wins for PPC and multi-channel agencies that want predictable scaling. AgencyAnalytics wins for all-around agency reporting with mature AI. Whatagraph wins for high-volume cross-channel reporting if an $812/mo annual commitment fits. DashThis wins for small agencies that want simplicity. Raven Tools wins for SEO-focused agencies. NinjaCat and TapClicks win for enterprise.
| Agency profile | Best fit |
|---|---|
| PPC or multi-channel, scaling | Swydo |
| All-around with bundled SEO | AgencyAnalytics |
| AI-first mid-market | Databox or Swydo |
| Small agency, simplicity | DashThis |
| SEO-focused | Raven Tools |
| Enterprise, multi-location | NinjaCat |
| Enterprise, complex data | TapClicks |
DashThis Individual ($54/mo monthly, $44/mo annual) for the simplest setup, Swydo ($69/mo monthly, $62/mo annual with 10 sources included) for multi-platform clients that need real-time alerts and AI summaries, AgencyAnalytics Freelancer ($79/mo monthly, $59/mo annual) if SEO tools matter, or Raven Tools ($49/mo monthly, $39/mo annual) for SEO-focused work.
Swydo’s flat base with 10 sources included often beats per-client tools as soon as clients have 3 or more data sources each, and real-time goal alerts, AI summaries with a 4,000-credit monthly allowance, the Client Portal, and PPC Markup are on every plan rather than gated behind higher tiers.
Swydo’s per-source pricing scales most economically at this stage. At 100 sources on annual billing, Swydo costs about $467/month with everything included: Monitoring Boards across all clients, Metrics Overview for portfolio-wide KPIs, AI summaries, Client Portals, and unlimited users.
For comparison, AgencyAnalytics Agency Pro at $349/month for 15 clients plus $16/month per additional client works out to $909/month at 50 clients on annual billing.
Swydo for agencies under 100 clients, NinjaCat for enterprise PPC agencies. Swydo’s Custom Metrics let you build a “Cost × 1.20” markup formula once and reuse it across every client, with real-time campaign monitoring on every plan. NinjaCat is the upgrade once you need AI agents and a managed Data Cloud.
AgencyAnalytics also supports Ad Spend Markup, but only on the Agency tier ($239/mo monthly, $179/mo annual) and above. Whatagraph and Raven Tools require manual markup calculation.
Raven Tools for pure SEO shops, because it bundles a rank tracker, backlink checker, and site audit into the reporting subscription and can replace a separate SEO tool. Starting price is $49/month monthly or $39/month annual prepaid.
AgencyAnalytics is the better choice for agencies that need broad PPC and social reporting alongside SEO and want modern AI. Raven’s weaknesses outside SEO — 25+ integrations and no meaningful AI — show up quickly on multi-channel work.
NinjaCat for multi-location enterprise clients in franchise, QSR, and healthcare. TapClicks for the most complex enterprise data needs. NinjaCat’s AI agents, managed Data Cloud on Snowflake, and 150+ integrations are the differentiators. TapClicks ships 250+ native connectors plus SmartConnector for anything else, and the widest AI stack in the category.
Both are quote-based with demo-only sales. Industry-reported NinjaCat contracts run $1,500 to $3,000/mo on annual terms, and TapClicks ranges from about $599/mo Basic to $1,500 to $5,000+/mo for full implementations.
AgencyAnalytics is better if you want one tool covering reporting, dashboards, and a built-in SEO toolkit and you’re under 25 clients. Swydo is better if you have 3 or more data sources per client, plan to scale past 25 clients, or need real-time alerts and PPC Markup without gating to higher tiers.
Cost crossover happens around 15 to 25 clients. AgencyAnalytics charges per client ($20/month monthly or $16/month annual per additional client). Swydo charges per data source, with rates dropping to $2/source above 500 sources.
AgencyAnalytics is better for most agencies on price and flexibility. It ships comparable AI features from $79/mo monthly or $59/mo annual, with bundled SEO tools and 80+ integrations against the 46 Whatagraph makes available on Max — its other 22, including Shopify, HubSpot, and Salesforce, need Prime. Whatagraph is annual-billing only and starts at $812/mo with a 50-credit floor, so the smallest commitment is roughly $9,700 for a year.
Whatagraph makes sense at genuine scale, or when funnel charts, EU data hosting, Source Groups for multi-market clients, or the Organize transformation layer are hard requirements. Below roughly 50 connected data accounts you’re paying for headroom you won’t use.
DashThis is better for solo operators with simple single-platform reporting and the smallest possible budget. Swydo is better for any agency with multi-platform clients, monitoring needs, or growth plans.
DashThis has no real-time goal alerts, only 9 widget types, no API, and ships with DashThis branding on the Individual plan, with custom domain only on Professional+. Swydo includes alerts, AI summaries, PPC Markup, and a custom-domain Client Portal on every plan from $69/month monthly or $62/month annual.
Specialized client reporting software typically costs $39 to $500 per month for SMB agencies, and $800 to $3,000+ per month for enterprise tools. The cheapest entry points are Raven Tools at $49/mo monthly, DashThis at $54/mo monthly, and AgencyAnalytics at $79/mo monthly.
| Tool | Starting price (monthly, USD) | Annual (per mo) |
|---|---|---|
| Raven Tools | $49/mo | $39/mo prepaid |
| DashThis | $54/mo | $44/mo |
| Swydo | $69/mo (10 sources included) | $62/mo |
| AgencyAnalytics | $79/mo | $59/mo |
| Databox | $80/mo (free tier available) | $64/mo |
| TapClicks | About $599+/mo (quote) | Quote |
| Whatagraph | No monthly option | $812/mo (Max, 50 credits) |
| NinjaCat | No monthly option | About $1,500 to $3,000/mo (quote) |
AI credits are a usage allowance. Each AI action — a report summary, a set of insights, a conversational query — deducts credits based on how complex the request is, so a large report costs more than a small one.
Swydo includes 4,000 credits a month on every plan, with an average report summary using about 95 credits. Credits reset monthly and don’t carry over. Past the allowance you set a spending limit and get billed only for what you use, so an unused month costs nothing. Billing → View usage details shows how many credits each thread and each team member consumed. Databox meters similarly, from 50 credits a month on Free to 4,000 on Growth. AgencyAnalytics, DashThis, and Whatagraph describe AI as included without publishing a comparable per-action number, which makes forecasting harder once AI becomes part of your monthly workflow.
Whatagraph, NinjaCat, and TapClicks. Every other tool in this guide publishes a monthly rate you can start and stop. Whatagraph is the outlier among self-serve tools, with no monthly billing on either plan, so the smallest purchase is a year at $812/month, roughly $9,700 committed up front.
Raven Tools sits in between. Monthly billing is available, but its discounted annual plans are prepaid in full rather than billed in installments. Swydo, AgencyAnalytics, DashThis, and Databox all offer true month-to-month billing alongside a discounted annual option.
Raven Tools at $49/month monthly, or $39/month annual prepaid, is the cheapest agency-specific tool. DashThis is second at $54/month monthly. Looker Studio is free but typically pulls in $20 to $500/month in third-party connector costs. Databox has a free tier, and Whatagraph discontinued its free plan and now starts at $812/month.
Your real cost depends on client count, sources per client, and which features sit behind a higher tier, not on the sticker price. Per-client models get expensive at scale, credit floors make you pay for capacity before you use it, and tools that sell white-labeling as an add-on can double the bill.
Yes. Databox has a free plan with 3 data sources, 1 user, and its Genie AI analyst included, and Looker Studio is free with native integrations to Google Ads, GA4, BigQuery, and Search Console. Whatagraph discontinued its free plan.
Both cost money in adjacent ways. Looker Studio agencies typically pay $20 to $500/month for third-party connectors, and Databox’s free tier carries Databox branding because white-labeling is a $200/month add-on.
Per-client pricing scales linearly with client count, so every signed client adds a fixed monthly cost regardless of how much you use the tool. AgencyAnalytics charges $20/month monthly, or $16/month annual, per additional client above plan limits.
For agencies with shallow data per client (1 or 2 sources each), per-client pricing is competitive. For agencies with deep data per client (5 or more sources), per-source models like Swydo’s tend to be cheaper because you’re not paying a flat fee for every logo on the roster.
A data source is each individual property or account connected to the tool, not each integration type. One Google Analytics integration connecting three website properties counts as three sources. One Meta Ads integration connecting two ad accounts counts as two sources.
This matters most for per-source models like Swydo and Databox, and for credit-based models like Whatagraph, where 1 credit equals 1 connected data account against a 50-credit floor on Max. Before signing, multiply your client count by average platforms per client by accounts per platform to forecast your real source count.
Switch when you spend more than 2 hours per week maintaining reports, when you’re paying for third-party connectors, or when you’ve lost dashboards because employees left. Time savings typically pay back the monthly cost within the first month.
Stay on Looker Studio if you’re technical, don’t need white-label or a polished client portal, and don’t need proactive alerts. After accounting for Supermetrics or Funnel.io fees ($20 to $500/month), a specialized tool is often cheaper anyway.
Most do. Swydo and AgencyAnalytics offer 14 days. DashThis offers 15 days. Databox offers 14 days on Growth. Raven Tools offers 7 days. Whatagraph offers a 14-day trial on Max with no credit card. NinjaCat and TapClicks are demo-only.
Swydo and AgencyAnalytics don’t require a credit card to start. Use the trial on the workflows that matter most: connecting your actual platforms, building a real client report, and triggering an alert.
TapClicks SmartSuite has the widest AI stack overall, followed by NinjaCat AI Agents at the enterprise tier. At the mid-market level, Swydo AI, AgencyAnalytics Ask AI, and Databox Genie ship comparable capabilities: generative summaries, conversational queries, anomaly detection. Whatagraph IQ matches them functionally at a $812/mo entry point. The right pick depends more on pricing model fit than on AI feature depth.
| AI feature | Tools that support it |
|---|---|
| Generative report summaries | Swydo, AgencyAnalytics, Whatagraph, DashThis, Databox, NinjaCat, TapClicks |
| Conversational data queries | Swydo, AgencyAnalytics, Whatagraph, DashThis (Pro), Databox, NinjaCat, TapClicks |
| Client-facing AI inside shared dashboards | Swydo |
| Prompt-to-report and prompt-to-widget building | Swydo, AgencyAnalytics, Whatagraph, NinjaCat, TapClicks |
| AI summaries inside scheduled emails | Swydo, TapClicks |
| Anomaly detection and alerts | Swydo, AgencyAnalytics (Pro), Whatagraph, Databox (Analyst+), NinjaCat, TapClicks |
| Predictive forecasting | AgencyAnalytics (Pro), Databox (Growth+), NinjaCat, TapClicks |
| MCP server for ChatGPT or Claude | Databox, Whatagraph |
| Autonomous AI agents | NinjaCat, TapClicks |
| AI-generated slides | TapClicks SmartSlides |
Four matter most: generative report summaries that write the narrative, conversational queries that let you ask the dashboard a question, anomaly detection that flags broken campaigns, and predictive forecasting that projects pacing to month-end.
Generative summaries deliver the biggest immediate time savings, because they write the wins-issues-recommendations section every agency writes by hand today. Anomaly detection and forecasting pay off more on high-spend PPC accounts where small drift costs real money. Be honest about whether your team will use a conversational layer or keep writing summaries manually.
In a handful of tools, yes. Swydo’s Agentic Reporting builds and edits reports through conversation: AI Report Builder generates a full report structure from one prompt, AI Widget Creation adds KPIs, tables, and charts in natural language, AI Widget Editing changes date ranges, chart types, metrics, and sorting from a description, and AI Section Management creates, renames, and moves sections. AgencyAnalytics Smart Reports, Whatagraph IQ, NinjaCat, and TapClicks SmartReports all offer versions of prompt-to-report generation.
Saved Prompts are the part that scales. Store the prompts that work and hand them to a new hire so their first client report comes out looking like everyone else’s.
Not in the tools that publish a policy on it. Swydo processes AI requests in the AWS cloud using commercially available models, and that data is not used for training. Requests route globally depending on which region has capacity, and the offering is GDPR compliant under a data processing agreement that already covers AWS services. NinjaCat is SOC 2 Type II certified and states that customer data is never used to train models.
For any tool without a published statement, ask before you connect a client account, especially if you serve healthcare, finance, or government clients. Ask three things: where the data is processed, whether it trains a model, and whether the DPA already covers the sub-processor.
Yes. All seven specialized tools support white-labeling. Custom domains are supported by Swydo, AgencyAnalytics (Agency tier+), DashThis (Professional+), Raven Tools, NinjaCat, and TapClicks. Whatagraph offers a custom report domain as a paid add-on on Prime only.
Check whether white-labeling is a plan feature or a separate line item. DashThis’s Individual plan ships with DashThis branding. Whatagraph includes white-label reports on both plans but charges extra for the custom domain. Databox sells branding and white-labeling as a $200/month add-on at every self-serve tier.
TapClicks has the most: 250+ native connectors plus SmartConnector for anything else. Integration count by tool: TapClicks (250+), NinjaCat (150+), AgencyAnalytics (80+), Whatagraph (68, of which 46 are on the $812/mo Max plan and 22 require Prime), Swydo (38+ and growing), DashThis (30+), Raven Tools (25+).
Depth beats count once you get past the headline number, and so does the plan a connector sits on. Whatagraph’s 22 Prime-only connectors include Shopify, WooCommerce, HubSpot, Salesforce, BigQuery, and Snowflake, so an agency with a single ecommerce or CRM client can’t use the published price. On emerging channels, Swydo and Whatagraph are the only two here with a native OpenAI Advertising connector for ChatGPT Ads.
Yes. Most specialized tools support cross-channel widgets that blend data from multiple ad platforms into single metrics like blended cost, blended ROAS, or total conversions. Swydo’s Combined Data Sources merges metrics from up to 5 ad platforms into single widgets, and the same blending works inside Goals, Alerts, and Metrics Overview rather than reports alone.
This matters when clients want one ROAS number across Google Ads, Meta Ads, and TikTok rather than three separate channel breakouts.
Yes, through manual KPI inputs or spreadsheet integrations. Swydo supports Manual KPIs for offline or unsupported data, formula-based Custom Metrics, and connections to both Google Sheets and Microsoft Excel. AgencyAnalytics and Whatagraph offer similar manual-entry fields. Most tools also integrate with Google Sheets as a fallback for anything without a native connector.
This matters for agencies reporting on call tracking, in-store sales, lead quality scores, or any KPI sourced from a CRM or spreadsheet rather than an ad platform.
Yes. Real-time goal and KPI alerts are supported by Swydo, AgencyAnalytics (Agency tier+), Whatagraph, NinjaCat, and TapClicks. Alerts fire when metrics cross thresholds, for example when a CPA breaks the goal or daily spend pacing falls below target.
Swydo also sends proactive integration-failure alerts that warn you when a connection breaks before reports send, which no other specialized tool in this lineup covers. DashThis and Raven Tools are weaker on alerts generally.
Swydo (PPC Markup via Custom Metrics), AgencyAnalytics (Ad Spend Markup, Agency tier+), and NinjaCat support PPC markup natively. TapClicks supports it through SmartSuite. DashThis offers basic markup on cost-metric widgets at every tier. Whatagraph and Raven Tools require manual calculation.
Swydo includes Custom Metrics on every plan, built directly inside widget settings, so you create a “Cost × 1.20” formula once and reuse it across every client on the same integration.
Goal tracking calculates a target glide path and shows whether each KPI is On Track, Off Track, or Achieved against it. Instead of displaying “CPA: $42,” the report shows “CPA: $42 (On Track, goal $45),” which turns a data dump into a conversation about whether the campaign is winning.
Swydo, AgencyAnalytics (Agency tier+), Whatagraph, NinjaCat, and TapClicks all support goal tracking with pacing states. Swydo also carries targets into the visuals: set a target on a heatmap widget and each cell is scored against it, green for met or beaten, red for below, and a dash where there’s no data.
Specialized reporting tools use OAuth to connect to ad platforms, so your client’s credentials never sit in the reporting tool itself. Enterprise tools like NinjaCat carry SOC 2 Type II certification and don’t use customer data to train AI models. Whatagraph runs an EU data center with ISO 27001 certification on both plans. Swydo processes AI in AWS under a GDPR-compliant DPA, with no training on your data.
For smaller tools, check the security page for SOC 2, GDPR compliance, and the AI training policy if you have clients in regulated industries. SSO and audit logs are often a paid add-on rather than a standard feature.
2 to 4 hours for the first dashboard with DashThis, Swydo, or AgencyAnalytics. 1 to 4 weeks for NinjaCat or TapClicks, because they include managed onboarding.
Self-serve tools ship with reusable templates that cut the time to a first polished report. Enterprise tools bundle setup services into the contract, which is worth budgeting for in the rollout timeline.
Run the old and new tools in parallel for at least one full reporting cycle, usually a month. Connect the same data sources to both, rebuild your most-used client reports in the new tool, and compare numbers side by side before anything goes to a client.
Historical data availability varies sharply by integration. Most ad platforms (Google Ads, Meta Ads, GA4) backfill on connection. Several organic and CRM connections (Instagram Business, LinkedIn organic, Pinterest organic, Mailchimp, ActiveCampaign, Klaviyo, TikTok organic) start accruing from connection day with no historical backfill, so onboard those early. Export existing dashboards as PDFs before you cancel the old tool.
Start free trials of two or three tools that fit your profile, connect the same real client account to each, and rebuild your current monthly report in every one. Pick the tool your team uses without complaining.
Test the workflows that matter: connecting the platforms you actually use, building a report that mirrors your current deliverable, scheduling and white-labeling the output, and triggering an alert if alerts are part of your criteria. Pay attention to which tools let you run month-to-month afterward, because a 14-day trial tells you less than a second billing cycle does.
Five things, in this order — the PIWGA framework: Pricing model, Integration depth, White-label and client portal, Goal tracking with real-time alerts, and AI features. The order is deliberate, because pricing model breaks more deals than AI ever will.
Real-time goal alerts are the item most agencies skip in evaluation and miss every month afterward. When a client’s CPA breaks the goal, you want a Slack ping that day.
Use roll-up reports or cross-account widgets to combine multiple accounts into one client view. AgencyAnalytics supports roll-up reports across multiple clients. Swydo’s Combined Data Sources merges up to 5 ad platforms into single widgets. NinjaCat and TapClicks handle this natively with multi-location reporting.
Multi-location reporting is the standout differentiator for franchise, QSR, and healthcare clients, and NinjaCat is purpose-built for it.
Yes, through client portals. Swydo, AgencyAnalytics (Agency tier+), Raven Tools, NinjaCat, and TapClicks all offer white-label client portals.
Swydo’s Client Portal puts Reports, Boards, and Goals behind one secure link per client, so the client sees the detailed monthly report, the board with their weekly KPIs, and their goal pacing in one place instead of three URLs. Open the client’s account, go to the Portal tab, enable it, pick what’s shared, preview what they’ll see, and send the link. Add a password when the client needs one, regenerate the link to kill previous access instantly, and change the contents whenever their reporting needs change. Most tools also support shareable URLs with no login and scheduled email delivery, so you can match how each client prefers to receive reports.
Yes. All seven specialized tools support reusable templates, but they handle updates differently. Swydo’s linked reports update every client report automatically when the underlying template changes. DashThis, AgencyAnalytics, and Whatagraph offer template duplication, with Whatagraph’s Linked Report Templates propagating master changes to children.
Linked templates save real time at scale, since one template change updates every linked client report instead of requiring per-client edits.
Swydo AI generates summaries in Dutch, English, French, German, Spanish, and more, with a separate in-app language picker for the interface itself. Most other tools support English plus a handful of European languages, and Whatagraph’s IQ Summary covers 18.
Test the actual translation quality during the free trial, because automated translation is usable for KPI labels and uneven for narrative summaries.
Use a BI tool (Looker Studio, Tableau, Power BI) when you have a dedicated data analyst, need to combine marketing with non-marketing data, have an enterprise client asking for those specific tools, or need custom data models the agency-specific tools can’t build.
For most agencies, meaning those without an analyst, reporting primarily on marketing data and serving SMB to mid-market clients, agency-specific tools save 10 to 20 hours per week and produce more polished deliverables out of the box.
Final Picks: Which Client Reporting Tool Fits Which Agency Type?
The recommendations below match each agency profile to a specific client reporting tool, with concrete pricing math in USD.
Which Client Reporting Tool Fits Your Agency?
Find the profile that matches yours, then the tool built for that situation
What does your agency look like?
↳ Solo or under 5 clients
Single operator, simple reports, smallest possible budget, often single-platform clients
DashThis$54/mo monthly, $44/mo annual, simplicity wins
↳ Small agency, 5 to 25 clients
Multi-channel clients with 3 or more data sources each, wants alerts, AI credits, and a client portal on every plan rather than two tiers up
Swydo$69/mo monthly, $62/mo annual, 10 sources included
↳ SEO-focused agency
Pure SEO shop wanting rank tracker, backlink checker, and reporting in one subscription
Raven Tools$49/mo monthly, $39/mo annual prepaid, cheapest entry
↳ Mid-size, 25 to 100 clients
Multi-channel reporting at scale, PPC markup billing, portfolio-wide monitoring, one portal link per client
SwydoAbout $467/mo at 100 sources, annual billing
↳ Wants bundled SEO toolkit
10 to 15 clients, wants rank tracker, backlink data, and Ask AI co-pilot, willing to pay the Agency-tier jump for AI features
AgencyAnalytics$239/mo monthly, $179/mo annual, Agency tier
↳ High-volume data-prep workflows
Cross-channel data unification, blends, custom transformations, multi-market Source Groups, 50 or more connected data accounts, EU data residency
WhatagraphFrom $812/mo annual, no monthly option
↳ Enterprise, multi-location
Franchise, QSR, and healthcare clients with hundreds of locations each, AI agents for monitoring
NinjaCatAbout $1,500 to $3,000/mo, annual contracts, quote only
↳ Enterprise, complex data
Niche or in-house data sources with no native connector, warehouse pushes to Snowflake or BigQuery, AI-generated decks
TapClicksFrom about $599/mo Basic, quote only
Prices in USD. NinjaCat and TapClicks do not publish rates, so those figures are aggregated third-party estimates.
Best Client Reporting Tool for Freelancers or Agencies Under 5 Clients
DashThis Individual ($44/mo annual) for the simplest setup, AgencyAnalytics Freelancer ($59/mo annual) if AI and SEO tools matter, or Swydo ($62/mo annual with 10 sources included) if clients have multiple data sources and monitoring matters.
Swydo’s flat $62/mo base on annual billing with 10 sources included often comes out cheaper than DashThis Individual once an agency has a couple of clients with 3+ sources each — and Swydo includes real-time alerts, AI-generated summaries, and PPC Markup that DashThis doesn’t offer at any tier. Swydo’s 14-day trial requires no credit card.
Best Client Reporting Tool for Small Agencies (5–25 Clients)
Swydo is the strongest fit for small agencies. Swydo’s $62/mo annual base plus volume-discounted per-source pricing typically lands cheaper than per-client tools as soon as an agency has 3+ sources per client, and unlike per-client models, the cost doesn’t jump every time the agency signs a new client.
Real-time goal alerts with On Track / Off Track / Achieved pacing states, Brand Templates that apply visual style across every client report, PPC Markup for management-fee billing, and proactive integration-failure warnings are on every Swydo plan. AgencyAnalytics Agency ($179/mo annual, 10 clients included) is the alternative if monitor your link-building campaigns matter.
Best Client Reporting Tool for Mid-Size Agencies (25–100 Clients)
Swydo’s per-source pricing scales economically for mid-size agencies. At 100 sources on annual billing, Swydo costs approximately $467/mo ($62 base + 90 sources × $4.50) with all features included. AgencyAnalytics Agency Pro at $349/mo annual for 15 clients plus $16/mo per additional client = $909/mo for 50 clients on annual billing.
Swydo’s Report Templates with linked reports also matter at mid-size scale: change a template once and every linked client report updates automatically — exactly the kind of leverage report automation for marketing agencies is supposed to deliver. Whatagraph (from $812/mo annual on Max) is the alternative once source counts pass 50 and EU data residency or multi-market Source Groups are hard requirements.
Best Client Reporting Tool for PPC Agencies Billing Management Fees
Swydo or NinjaCat for PPC agencies. Swydo fits agencies under 100 clients — Custom Metrics let agencies build a “Cost × 1.20” markup formula once and reuse it across every client, real-time campaign monitoring is on every plan, and per-source pricing scales to hundreds of accounts without per-client penalties.
NinjaCat (third-party estimates: $1,500–$3,000/mo annual contracts) is the upgrade for enterprise PPC agencies that need AI agents and managed Data Cloud. For paid-media agencies weighing a wider set of options, our roundup of the best PPC reporting tools includes both reporting platforms and PPC-native tools.
Best Client Reporting Tool for SEO-Focused Agencies
Raven Tools ($39–$399/mo annual prepaid) for the bundled SEO toolkit. AgencyAnalytics is a stronger choice if the agency also needs broad PPC and social reporting and wants modern AI. For SEO-only agencies comparing options, our guide to the best SEO reporting software covers the dedicated SEO reporting tools agencies typically run alongside or instead of Raven.
Best Client Reporting Tool for Mid-Market Agencies Wanting Top AI Features
Databox Growth ($499/mo monthly, $399/mo annual) is the pick for mid-market agencies prioritizing AI. It bundles AI Analyst, anomaly detection, forecasting, and an MCP server integration with ChatGPT and Claude, with per-source overage pricing rather than a plan floor. Whatagraph left this bracket in 2026 when it consolidated to two annual-only plans starting at $812/mo, which is more than double Databox Growth for comparable AI breadth.
AgencyAnalytics Agency Pro ($349/mo annual) is the third option for agencies preferring per-client pricing and bundled SEO tools. If AI matters but isn’t the sole deciding factor, Swydo is worth the comparison too — Swydo AI ships conversational queries, section-level analysis, and multilingual summaries on every plan from $62/mo annual, with no AI-tier upsell.
Best Client Reporting Tool for Enterprise Agencies Serving Multi-Location Clients
NinjaCat (third-party estimates: $1,500–$3,000/mo annual contracts) for multi-location enterprise agencies. Multi-location reporting and AI agents are NinjaCat’s core differentiators.
Best Client Reporting Tool for Large Agencies With Complex Enterprise Data
TapClicks (third-party estimates: $599+/mo Basic, $999/user/mo Pro, $1,500–$5,000+/mo full implementations) for large agencies with complex data. TapClicks’ 250+ native connectors plus SmartConnector for everything else is unmatched, and SmartSuite is the broadest AI stack in the category.
Best Reporting Tool for Agencies With a Dedicated Analyst
Looker Studio (free) plus Supermetrics or Funnel.io for non-Google data, or Tableau Cloud Standard Creator at $75/user/mo annual for agencies with the budget and analyst depth to leverage it.
Final Thoughts
Run every shortlisted tool through PIWGA — Pricing model, Integration depth, White-label, Goal tracking, AI features — and verify the USD pricing yourself on each vendor’s site before you book a single demo. Pricing changes; the figures in this guide were verified in May 2026, but every vendor reserves the right to update tiers, add fees, or change billing terms. The right tool matches how your agency actually works: client mix, billing model, team’s technical depth, and growth trajectory.
Most agencies should free-trial two or three tools that fit their profile, run them on the same client account for two weeks, and pick the one their team uses without complaining.
Build white-labeled client reports across every channel — without the per-client price tag.
Start Your Free Trial Today