
The most important Google Ads metrics in 2026 are profit-based outcome metrics like POAS, ncROAS, and CPQL, paired with diagnostic metrics like Search Lost IS by reason and modeled conversions. Headline metrics like CTR, CPC, and impressions belong in the appendix.
That’s where most agency reports still lag.
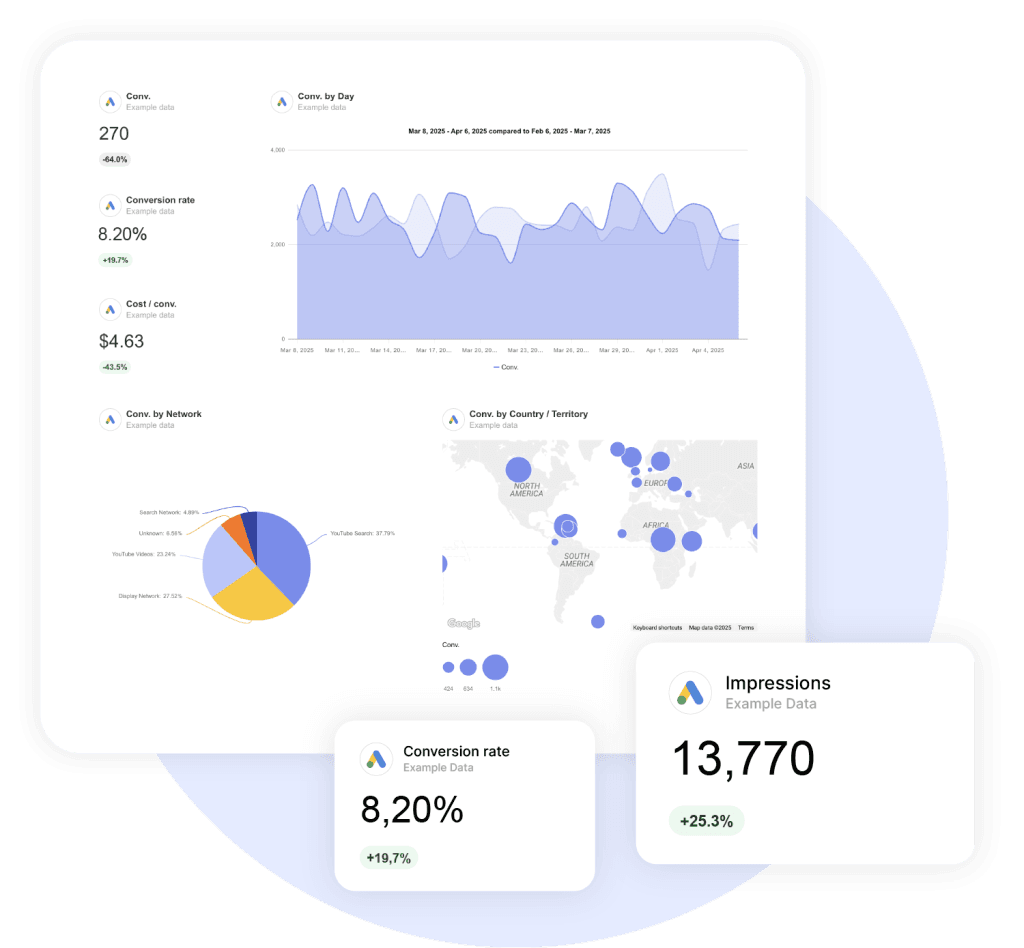
Walk into any agency right now and pull the last five client decks. You’ll likely find click-through rate at the top of slide one, a neat little CPC trend line on slide two, and impressions in bold somewhere because the number is big. Quality Score might be sitting on slide four, averaged across the entire account.
Google Ads has changed materially over the last 24 months, especially around automation, measurement, attribution, and Performance Max reporting. Performance Max is more reportable than it used to be, even though budget allocation is still algorithmic. AI Max for Search became an opt-in layer for standard Search campaigns, and legacy Dynamic Search Ads features are scheduled to move into AI Max starting in September 2026. Consent Mode V2 has created real conversion-tracking gaps for some EEA and UK advertisers that have not passed valid consent signals correctly. Four attribution models were retired. Enhanced CPC was deprecated.
If your reporting hasn’t caught up, you’re showing your client yesterday’s scoreboard.
This guide gives you the framework for what to actually track now, organized by what matters most, what’s just supporting evidence, and what’s noise dressed up to look impressive. We’ll cover the metric hierarchy that separates good agencies from great ones, the benchmarks worth quoting, and the vertical-specific cuts that turn a generic report into something a CFO actually reads.
The 5 Tiers of Google Ads Metrics (At a Glance)
The fastest way to fix your reporting is to stop treating every metric as equally important. They aren’t. Here’s the hierarchy, top to bottom.
The Hierarchy
5 Tiers of Google Ads Metrics — Where Each One Belongs
Outcome Metrics
What the client actually pays you to move.
ROAS · POAS · ncROAS · CPQL · LTV:CAC
Efficiency Metrics
How sustainably spend converts to outcomes.
CPA · Conversion value per cost
Engagement & Relevance
Diagnostics that explain why outcomes moved.
CVR · CTR · Quality Score
Visibility Metrics
Whether you have headroom to grow.
Impression Share · Lost IS by reason · Auction Insights
Health Metrics
“Are the lights on” check-ins. Never headlines.
Impressions · Clicks · CPC · CPM
If your client can’t see the Tier 1 metrics in the first 30 seconds of the report, you’ve buried the lede. We’ll break each tier down in detail, but that table alone is the single biggest structural fix most agencies need.
Why “the Most Important Metric” Is the Wrong Question
Most articles hand you a list of 10 metrics and call it a day. The real question isn’t which metrics matter. It’s what role each metric plays.
A metric is one of three things: a north star (the thing you’re trying to move), a diagnostic (something that explains why the north star moved), or a vanity metric (something that looks impressive but doesn’t connect to either).
Think of it like a car dashboard. The speedometer tells you how fast you’re going. The temperature gauge tells you whether something’s about to go wrong. The chrome trim around the gauges? That’s vanity.
All three are visible. Only two are useful. And only one tells you whether you’re going to make it where you’re going.
Your Google Ads metrics work the same way. The trouble is, most reports treat every metric as if it sits at the same level. CTR gets the same real estate as ROAS. Impressions show up before profit. Quality Score gets averaged across an account even though Google explicitly says not to aggregate it (we’ll get to the receipt for that one in a minute).
Which tier does each metric belong in?
Tier 1: Outcome Metrics
These are the metrics your client actually pays you to move. If you’re not leading with these, the report is likely over-weighting diagnostics.
ROAS (Return on Ad Spend)
ROAS is revenue divided by ad spend. A 4:1 ROAS means $4 in revenue for every $1 you spend.
It’s the most-cited outcome metric in PPC, and for good reason. It’s intuitive. Easy to communicate. Tied directly to revenue.
Most reports gloss over one thing: ROAS is a revenue metric, not a profit metric. If your client sells a $100 product with $20 of margin and ships it for free, a 4:1 ROAS isn’t profitable. It’s a slow leak.
One secondary 2025 analysis from Focus Digital, based on 5,000+ accounts and multiple data sources, reported these directional ROAS benchmarks:
- Search campaigns: 5.17:1
- Performance Max: 2.57:1
- Smart campaigns: 1.72:1
- Standard Display: 0.12:1
For e-commerce specifically, Triple Whale’s 2025 dataset (drawn from 18,000+ brands) put blended Google Ads ROAS at 3.68:1, down 10% year over year. Worth noting: 13 of 14 e-commerce verticals saw ROAS decline in 2025. Only Pets & Animals went up, by 2.5%.
When ROAS moves, ask yourself: did conversion value change, did cost change, or both? A ROAS drop with stable revenue means you’re paying more for the same outcomes. That’s usually competitive pressure.
POAS (Profit on Ad Spend)
POAS is gross profit divided by ad spend. It’s the metric most articles haven’t caught up to yet, and it’s increasingly common among margin-aware e-commerce operators.
The math is simple. ROAS uses revenue. POAS uses profit. A 4:1 ROAS on a high-margin product is great. A 4:1 ROAS on something you sell at cost is bankruptcy on a treadmill.
According to Profitmetrics’ POAS guide, break-even POAS is always 1.0. Typical targets land between 1.4 (controlled growth) and 2.0+ (max profitability). Implementing it requires sending SKU-level margin data as conversion value to Google Ads, usually through a tool like Profitmetrics, Channable, or smec.
Why does this matter for you as an agency? Because Smart Bidding optimizes against whatever conversion value you feed it. Feed it revenue, and it optimizes for revenue, including the unprofitable kind. Feed it profit, and it optimizes for the kind of growth that actually shows up in the bank account.
If your client sells products with materially different margins, POAS or another profit-weighted value signal should be on the roadmap. ROAS will systematically over-invest in the wrong products. Picture a beauty brand with a 70%-margin serum sitting next to a 15%-margin razor. Optimizing for revenue tells the algorithm both products are equally valuable. They’re not.
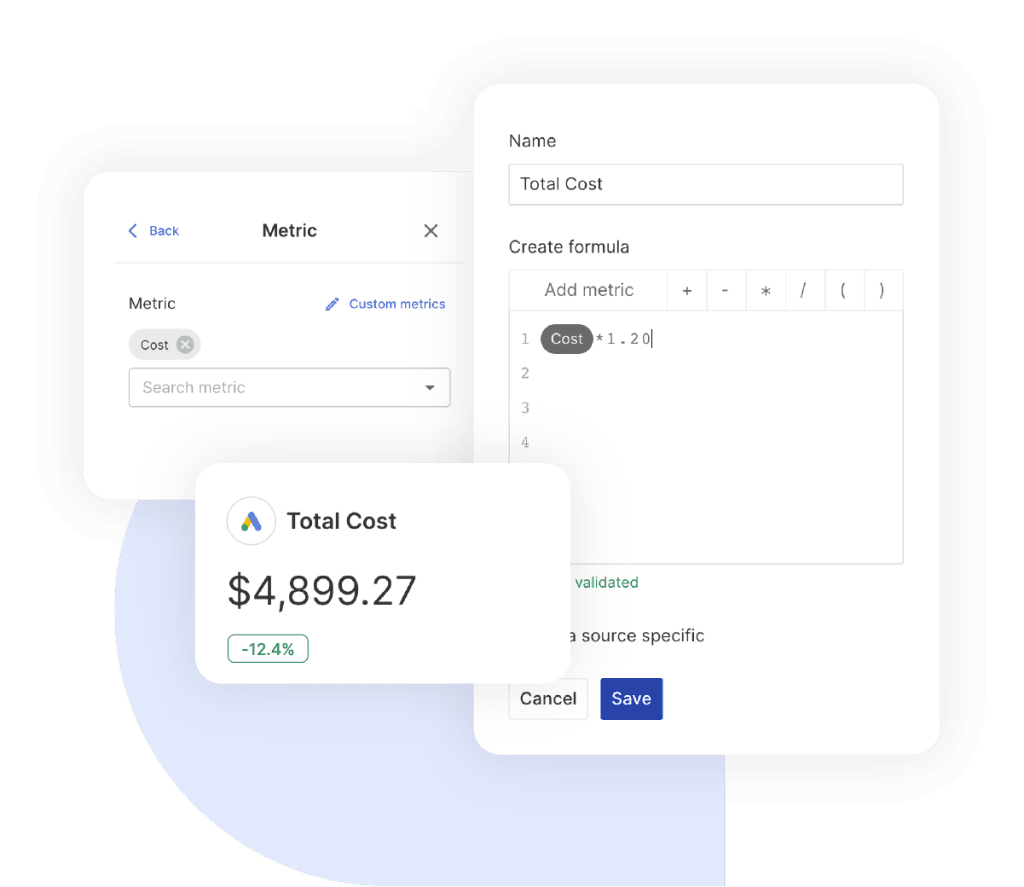
POAS isn’t a native Google Ads metric, which is the main reason it doesn’t show up in most agency reports. If you’re using Swydo, you can build it once as a Custom Metric — typing in the formula like any other calculation — and it’ll update across every client report you apply it to.
CPA (Cost per Acquisition)
CPA is total cost divided by total conversions. It’s the workhorse metric for lead-gen accounts the way ROAS is for e-commerce.
It’s also the target you set when using Target CPA bidding, which means the value you choose has direct campaign consequences.
The 2025 cross-industry CPA average was $70.11, up 5.13% year over year. The spread is enormous. Auto Repair sits at $28.50. Furniture is at $121.51. Industry benchmarks are useful as sanity checks, not targets — we’ll get to the full table further down.
The CPA mistake to avoid? Treating it as a single number when conversions aren’t created equal.
A $50 CPA where 10% of leads close is a $500 customer acquisition cost. The same $50 CPA at a 30% close rate is $167. Without lead quality data flowing back from a CRM, CPA tells you about half the story.
ncROAS (New Customer ROAS)
ncROAS is what you pay specifically to acquire new customers, separated from existing-customer revenue. Google Ads makes this available through Customer Lifecycle Goals, and it powers Performance Max’s “high-value new customer mode.”
Why does it matter? Aggregate ROAS often hides a slow decline in new customer acquisition. Your existing customers searching for the brand inflate the headline number while non-brand prospecting quietly tanks.
For DTC brands, subscription businesses, and any client where retention drives the LTV math, new vs. returning ROAS should usually be separated. It’s the difference between a healthy business and one about to hit a wall when retention plateaus. Search Engine Land’s coverage of customer acquisition goals is a good primer if your client hasn’t set this up yet.
CPQL (Cost per Qualified Lead)
CPQL is the cost per lead that meets a qualification threshold, like an MQL or SQL.
For B2B and lead-gen agencies, this is the metric that separates real performance from pipeline theater. Raw CPL tells you how efficiently you’re collecting form fills. CPQL tells you whether those form fills are worth anything.
WhatConverts breaks the math down. If you’re paying $50 per lead and 5% of those leads are qualified, your true CPQL is $1,000. The 95% of unqualified leads aren’t free. Your sales team is paying for them with their time.
The implementation isn’t trivial. It requires an offline conversion import or a CRM integration that flags qualified leads back to Google Ads. But once it’s in place, you can let Smart Bidding optimize for SQL volume instead of total form fills, and the entire campaign quality changes.
LTV:CAC Ratio
LTV is the total revenue (or profit, ideally) a customer generates across their relationship with the business. LTV:CAC is the ratio of that value to what you paid to acquire them.
For SaaS and subscription brands, this is the only acquisition metric that makes sense.
A first-touch ROAS of 0.5:1 looks catastrophic until you realize the customer pays $99/month for an average of 28 months. The healthy benchmark is 3:1+. Top quartile companies hit 5:1 or better.
How do you operationalize this? Pass LTV cohort data back to Google Ads as conversion value, then let Smart Bidding optimize against it. You’re effectively telling the algorithm “this lead is worth $400, that one is worth $40,” and it adjusts bidding accordingly.
Tier 2: Efficiency Metrics
If outcome metrics tell you whether the campaign is working, efficiency metrics tell you how sustainably it’s working.
Conversion Rate (CVR)
CVR is conversions divided by clicks. The 2025 cross-industry average was 7.52%, per LocaliQ’s search advertising benchmarks.
But “good” depends entirely on what the conversion is. A 7% form-fill rate is solid. A 7% purchase rate is incredible. Comparing across conversion types is meaningless.
The right way to read CVR is as a directional indicator paired with the traffic source. A high CVR on broad-match keywords means your matching is finding real intent. A high CVR on branded keywords means people who already know you are converting, which tells you nothing about acquisition.
Always segment.
When CVR drops while traffic stays flat, the answer is usually one of three things: landing page degradation, audience shift, or seasonal intent change. Test in that order.
Sophie Logan, PPC Lead at Beauhurst, put it well in a Swydo interview: “A big red flag for me is when a PPC landing page receives a high level of traffic through search terms indicating the relevant interest and intent but fails to convert those visitors once they’re on the page.” That’s the diagnostic in action. High-intent traffic + low CVR = the page isn’t doing its job. Fix the page before you touch the campaign.
CPC (Cost per Click)
CPC is total cost divided by clicks. The 2025 cross-industry average was $5.26, up 12.88% year over year, per Search Engine Journal’s analysis of 2025 Google Ads benchmarks. That’s the fifth consecutive annual increase.
CPCs have been rising for several years in the LocaliQ benchmark set, so treat CPC inflation as a planning assumption unless your own account data shows otherwise.
CPC matters as a diagnostic, not a goal. Lowering CPC by switching to lower-intent keywords usually tanks conversion rate, which means CPA goes up.
What you actually want to watch is the relationship between CPC and CVR. If CPC is rising but CVR is rising faster, you’re winning. If CPC is rising and CVR is flat, you’re losing ground.
A useful drill-down? Segment CPC, CVR, CPA, and conversion value by device, time of day, and audience before making bid or budget decisions. The aggregate often hides huge spreads.
Tier 3: Engagement and Relevance
These are diagnostics. They explain why your outcome metrics moved.
Click-Through Rate (CTR)
CTR is clicks divided by impressions. The 2025 cross-industry average was 6.66%, up 3.74% year over year. Variance by industry is significant. Arts & Entertainment hits 13.10%. Business Services lands at 5.65%.
CTR has been demoted in modern PPC.
It used to be a primary KPI because Quality Score depended on it heavily. What CTR tells you now is whether your ad copy and targeting are aligned. High CTR with low CVR? Wrong audience. Low CTR with high CVR? You’re showing to the right people but not getting clicked. That’s usually a creative problem.
The mistake most agencies make is leading with CTR in client reports. CTR doesn’t pay rent. It’s a diagnostic. Put it on slide 8, not slide 1.
Quality Score
Quality Score is Google’s 1–10 rating of how relevant your keyword, ad, and landing page combination is to a search query. It has three components: Expected CTR, Ad Relevance, and Landing Page Experience. Each shows up as Below Average, Average, or Above Average.
Google says directly in their own documentation: “Quality Score is not a key performance indicator and should not be optimized or aggregated.”
That’s not a typo.
The thing every agency reports as an account-wide average is something Google explicitly tells you not to aggregate. Quality Score is a per-keyword diagnostic, useful for identifying specific keywords with relevance problems. Not a campaign health indicator.
Quality Score is a proxy diagnostic for relevance issues that can correlate with higher or lower costs. The live auction uses Ad Rank and real-time quality signals, not the visible 1–10 Quality Score itself.
Here’s the rough impact, based on Store Growers’ analysis:
CPC Impact
How Quality Score Quietly Rewrites Your CPC
A Quality Score of 5 sets your baseline cost. Everything above earns you a discount. Everything below charges you a premium — sometimes a brutal one.
The component-level diagnostics are where the actionable information lives. The 1–10 number on its own is mostly noise.
A quick note on Ad Strength. Google frames the metric ranging from “Incomplete” to “Excellent” as feedback for improving assets, not a direct serving-eligibility factor. Google Ads Liaison Ginny Marvin has also confirmed Ad Strength is not used in Ad Rank.
Optimizing for “Excellent” Ad Strength as if it were a KPI is a category error.
Tier 4: Visibility Metrics
These tell you whether you have headroom to grow, or whether competitors are eating into your share.
Search Impression Share (IS)
Search IS is impressions received divided by total eligible impressions. It’s the percentage of available auctions you’re actually showing up in.
The numbers always add up to roughly your total opportunity:
The split tells you exactly what’s holding you back.
There is no universal “good” impression-share target. Chasing the last slice of impression share often gets expensive. Before pushing toward 100%, check whether incremental spend still meets CPA, ROAS, or profit targets.
The exception? Brand keywords. High IS protects against competitor encroachment.
Search Lost IS (Budget) vs. Search Lost IS (Rank)
Two metrics, two completely different actions. Most agencies fumble this.
Confusing these two is one of the most expensive mistakes in PPC management.
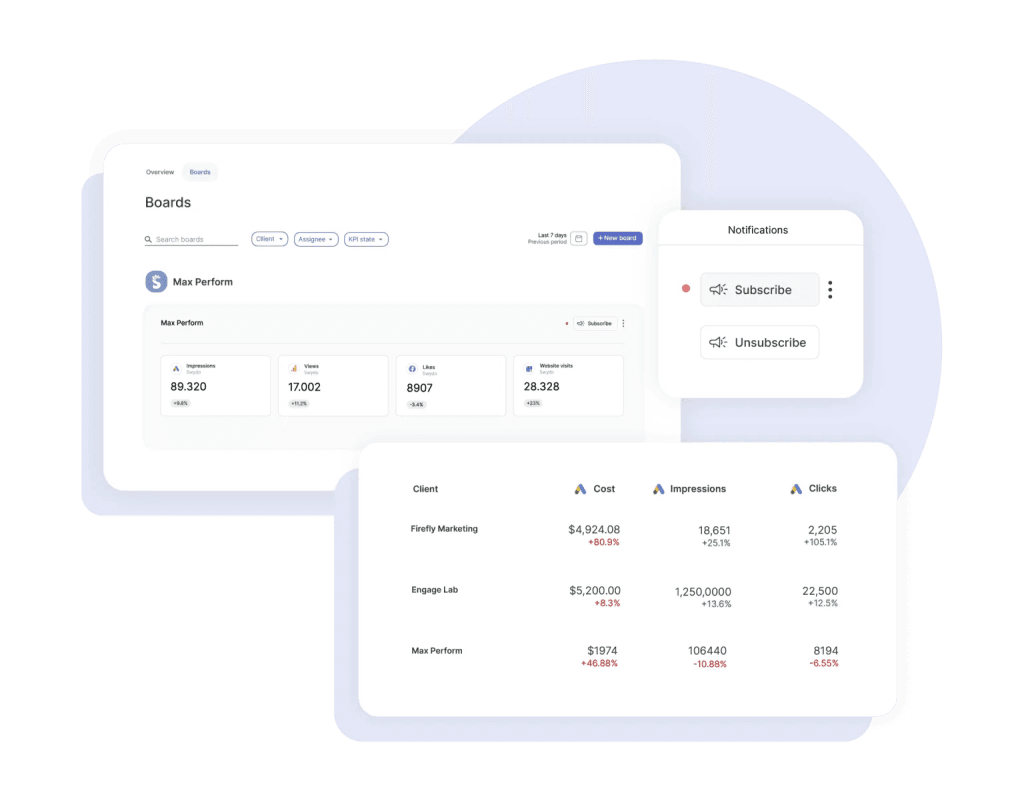
The reason this gets missed is timing. By the time you spot a budget-cap problem in a monthly report, the client has already lost a month of conversions. A Monitoring Board with alerts on Lost IS (Budget) flags it the day it happens, not the day you sit down to write the report.t) flags it the day it happens, not the day you sit down to write the report.
Auction Insights
Auction Insights is a separate report showing how you stack up against specific competitors in the same auctions. It includes Impression Share, Overlap Rate, Outranking Share, Position Above Rate, and Top of Page Rate.
Overlap Rate is the most actionable. It identifies who your actual competitors are at the auction level, which is often very different from who the client thinks their competitors are.
The boutique brand convinced they’re competing against the legacy player might find their real auction overlap is with a DTC challenger they’ve never heard of. That kind of detail reshapes a strategy meeting.
One important constraint to know about: as of August 2024, Auction Insights data is no longer available outside the Google Ads UI. No Looker Studio. No API. Pull it manually for client reports.
Tier 5: Health Metrics
These are the “are the lights on” metrics. Useful to glance at. Never useful as headline numbers.
- Impressions are vanity in isolation. They’re only worth tracking when paired with impression share, viewability, or CTR. For Performance Max and Demand Gen, impressions blend across YouTube, Discover, Gmail, and Display unless you segment by channel.
- Clicks are how many times users clicked, not the same as “interactions.” For video and Demand Gen carousel formats, clicks count specific actions, not all engagements. It’s worth checking the invalid clicks metric occasionally for click-fraud diagnostics, especially in legal and home services.
- CPM is mostly relevant for awareness campaigns and YouTube. If you report it, source the benchmark directly and separate YouTube, Shorts, Connected TV, Display, and Demand Gen instead of treating CPM as one blended number. According to Mega Digital’s 2026 YouTube benchmarks, the average YouTube CPM sits around $3.53, with Shorts running about $4 and Connected TV ranging from $10 to $38.
Track them. Reference them when something looks off. But don’t let them anchor your client’s understanding of campaign health.
The 2026 Metrics Most Agencies Haven’t Caught Up to Yet
Five things changed in 2025 that fundamentally shifted what should be in your report. If your reporting framework hasn’t been updated since 2024, you’re missing all five.
Performance Max Channel-Level Reporting
For three years, Performance Max felt like a black box. You put in budget, conversions came out, and you couldn’t see where Google was actually spending. Google announced Performance Max channel performance reporting in April 2025, which made the campaign type more reportable, though still heavily automated.
You can now see more channel-level contribution across surfaces such as Search, YouTube, Display, Discover, Gmail, Maps, and Search Partners, depending on the available reporting view.
You still can’t reallocate budget across those channels manually. The optimization happens algorithmically. But you can finally answer the question every client has asked since 2022: “where is my Performance Max budget actually going?”
That alone changes the conversation.
Add in Final URL reports, richer asset metrics, and PMax Auction Insights, and Performance Max in 2026 is more reportable and controllable than it was in 2024, though still heavily automated.
AI Max for Search Reporting
Google introduced AI Max for Search in May 2025, with global beta rollout starting then, broader availability by early Q3 2025, and the feature moving out of beta in April 2026. It’s not a new campaign type. It’s an opt-in suite layered onto standard Search campaigns, including search term matching expansion, automatic text customization, and Final URL expansion.
Starting in September 2026, legacy Dynamic Search Ads features are scheduled to auto-upgrade into AI Max for Search.
What should you track?
- Search terms report with the “Match type” column (broad match vs. AI Max expansion)
- AI Max expanded matches and AI Max expanded landing pages
- Conversion rate segmented by match type (to verify AI Max isn’t lowering efficiency)
- Account-level ROAS (to detect cannibalization of branded traffic)
Google’s pitch is +14% conversions at similar CPA for non-retail and +27% for keyword-heavy campaigns.
Independent analysis tells a more nuanced story. AI Max behaves like a volume-expansion layer, with revenue lifts often offset by higher marginal CPAs. Treat it like prospecting, not pure efficiency.
Privacy-Era Measurement
Consent Mode V2 has been mandatory for EEA and UK traffic since March 2024. In July 2025, Google enforcement became more visible: affected EU advertisers reported disabled personalization, remarketing, and conversion tracking where Consent Mode V2 signals were missing or non-compliant.
PPC Land documented cases where measured conversions collapsed after Consent Mode V2 enforcement because consent choices were not being passed correctly.
Three things to track:
- Modeled conversions. ML-imputed conversions for unconsented traffic, blended into the standard Conversions column. Eligibility requires properly implemented Consent Mode V2 plus at least 700 ad clicks per week per country and domain.
- Enhanced Conversions coverage. Hashed first-party data for cross-device matching. Target 50%+ coverage. Below 30% indicates an implementation problem. Verify in Goals → Conversions → Diagnostics.
- Server-side tag implementation status. Server-side tagging can improve control over data collection and may reduce some client-side measurement loss, but it is not a magic fix for consent, browser restrictions, or ad blockers.
This is the kind of stuff most agencies don’t put in client reports because it sounds technical. The framing that works with clients: “we recovered 14% of conversions that were previously invisible to your bidding algorithm.”
That’s a CFO-friendly sentence. And it’s true.
Attribution Models, Simplified
In September 2023, Google removed four attribution models from Google Ads and Google Analytics 4: First Click, Linear, Time Decay, and Position-Based. All accounts using them were auto-migrated to Data-Driven Attribution.
The Model Comparison report is now limited to comparing DDA vs. Last Click only.
If you’re reading an article that lists all six attribution models as if they’re still options? That article is at least three years old.
DDA is the default attribution model for most conversion actions. Google now says all conversion actions are eligible for DDA regardless of volume, though it recommends at least 200 conversions and 2,000 ad interactions in supported networks over 30 days for stronger model performance.
For agencies, this simplifies things. You no longer need to argue with clients about which attribution model is “best.” There are essentially two options now. DDA if you have the volume. Last Click if you don’t.
Original Conversion Value
Of all the 2025 reporting changes, this one gets missed most often.
In late 2025, advertisers began seeing a new column called “Original Conversion Value” that strips away conversion value rule adjustments, new customer acquisition multipliers, and lifecycle bonuses. It shows raw conversion value before those adjustments are applied.
Why does it matter? Because the conversion value reported in the Google Ads UI can differ from what the client sees in Shopify, HubSpot, or another back-end system for many reasons, including value rules, attribution windows, modeled conversions, returns, and deduplication.
Original Conversion Value helps with one piece of that reconciliation: value-rule adjustments. It is not the whole bridge between Google Ads and the CRM, but it gives you a cleaner view of the value Google started from before applying conversion value rules.
2025 Google Ads Benchmarks by Industry
If you’re going to quote benchmarks to your client, quote the right ones. The canonical 2025 data comes from WordStream’s 2025 benchmark report, based on 16,446 US campaigns from April 2024 through March 2025.
Here’s the full table for Search.
2025 WordStream Data · 16,446 US Campaigns
Google Ads Benchmarks by Industry
Sortable. Searchable. The bar under each number shows where it falls in the industry range — quick visual cue for spotting outliers. Tap a column header to sort.
| Industry ▲▼ | Avg CTR ▲▼ | Avg CPC ▲▼ | Avg CVR ▲▼ | Avg CPL ▲▼ |
|---|
Year-over-year shifts worth knowing: CTR up 3.74%, CPC up 12.88% (the fifth straight rise), CVR up 6.84%, CPL up 5.13%. 87% of industries saw CPC increases, led by Beauty (+60%), Education (+42%), and Shopping (+34%).
Use these as sanity checks, not targets. Your client’s numbers should be evaluated against their own historical performance first, the industry benchmark second.
Vertical-Specific Metric Stacks
Generic recommendations fall apart the moment you compare an e-commerce client to a B2B SaaS client. Here’s what actually matters by vertical.
By Industry
Vertical-Specific Metric Stacks
Generic recommendations fall apart the moment you compare an e-commerce client to a B2B SaaS client. Tap a vertical to see what actually matters.
Top Metrics
Top Metrics
Top Metrics
Top Metrics
Top Metrics
Top Metrics
Top Metrics
Top Metrics
Top Metrics
Top Metrics
The Mistakes Agencies Make Most Often
These are the Google Ads mistakes we see most often when we audit agency reporting. Run your current reporting against this list. You’ll probably find at least three of these in your decks.
- Reporting impressions, clicks, and CTR as headline KPIs. They’re diagnostics. Move them to the appendix.
- Confusing IS Lost (Budget) with IS Lost (Rank). Different problems, different fixes, opposite actions.
- Reporting account-average Quality Score. Google explicitly tells you not to. Use the per-keyword diagnostic data instead.
- Optimizing for Ad Strength as if it impacts auction performance. It doesn’t.
- Last-click attribution in B2B and brand-sensitive verticals can undervalue earlier touches.
- Counting calls as conversions based on duration alone. You’re feeding the algorithm bad data.
- Same ROAS target across all funnel stages. Prospecting and retargeting do different jobs.
- Failing to separate new vs. returning customer revenue. Aggregate ROAS hides slow acquisition decline.
- Trusting in-platform conversions as the single source of truth. In-platform conversion reporting can differ from CRM or ecommerce back-end data, especially for PMax, retargeting, modeled conversions, and multi-touch journeys. Reconcile to the CRM.
- Set-and-forget on Performance Max, AI Max, or Demand Gen. Automation isn’t autopilot.
- Reporting metrics outside the client’s vocabulary. If the CFO can’t understand it, simplify it or replace it.
- Chasing 100% impression share on non-strategic terms before checking whether the incremental spend still meets CPA, ROAS, or profit targets.
How many of these are in your last client report?
How to Choose Which Metrics to Put in Your Reports
The framework is simpler than most checklists make it sound. Ask three questions about every metric on every report.
The 3-Question Filter
How to Decide Which Metrics Earn a Spot in Your Report
The metrics that make a report defensible are the ones tied specifically to the client’s vertical, funnel, and goals. Not the ones any agency could pull from any account.
Most agency reports answer “no” to all three questions on most of the metrics they include. That’s the gap.
Closing it doesn’t require new tools or new tactics. It requires deciding which numbers earn their place on the page.
PPC and SEO expert Veronika Holler summed it up: “The most important KPI for me is the conversion value — but of course, the KPIs depend on the campaign’s goals. If I have a brand awareness campaign, I look at the impressions and clicks. Ultimately, however, I bring everything together and examine the revenue.” That’s the right mental model. Match the metric to the campaign’s job, and let revenue be the final arbiter.
Once you’ve picked the metrics that matter, the next question is what target counts as “on track” for each one. Setting a Goal on your outcome metrics gives you a daily on-track / off-track / achieved status, so you spot pacing problems before the end-of-month report instead of explaining them after the fact.
The Quick Reference Cheat Sheet
If you read nothing else, this is what to pin to your monitor.
- Every account, every report: outcome metric (ROAS, POAS, or CPA depending on business model), efficiency metric (cost per qualified outcome), conversion rate, Search IS by reason (Budget vs. Rank).
- E-commerce: add POAS, ncROAS, MER, AOV.
- B2B / lead gen: add CPQL, MQL→SQL rate, pipeline contribution.
- SaaS: add LTV:CAC ratio, trial-to-paid conversion, cohort ROAS.
- Local services: add qualified call rate, cost per booked appointment.
- Performance Max users: add channel-level breakdown, search themes performance.
- AI Max for Search users: add match-type-segmented conversion rate.
- EEA/UK traffic: add Enhanced Conversions coverage and Consent Mode V2 status.
Now go look at your last five client reports. How many of these are actually in there?
Agencies that move from a flat list of 10 metrics to a tiered framework with vertical-specific cuts and modern measurement signals produce reports that justify the retainer. Because the metrics on the page actually connect to the dollars in your client’s bank account.
Once you’ve fixed the reporting side, the next thing worth running on every account is a Google Ads optimization checklist — same idea, applied to the campaign itself instead of the report.
That’s the bar. Anything less is just CTR with extra steps.
Google Ads Metrics: Frequently Asked Questions
Direct answers to what advertisers, agencies, and CFOs are actually searching
The most important metric is the one tied directly to profit, not clicks. For e-commerce that’s POAS (Profit on Ad Spend) or ROAS. For lead gen it’s CPQL (Cost per Qualified Lead). For SaaS it’s LTV:CAC. There is no single answer that fits every account — the right metric depends on what the business actually sells and how it makes money.
What is universal: CTR, CPC, and impressions should never be your headline KPI. They’re diagnostics that explain why outcome metrics moved. If a client’s report leads with click-through rate, the report is structured wrong.
Five tiers, ranked by how much they should influence decisions:
| Tier | Type | Examples | Where It Belongs |
|---|---|---|---|
| 1 | Outcome | ROAS, POAS, ncROAS, CPQL, LTV:CAC | Slide 1 |
| 2 | Efficiency | CPA, conversion value per cost | Slide 2 |
| 3 | Engagement | CVR, CTR, Quality Score | Mid-deck |
| 4 | Visibility | Impression Share, Lost IS, Auction Insights | Mid-deck |
| 5 | Health | Impressions, clicks, CPC, CPM | Appendix |
If your client can’t see Tier 1 numbers in the first 30 seconds of the report, you’ve buried the lede.
A KPI is a metric tied directly to a business outcome — revenue, profit, qualified pipeline. A diagnostic is a metric that explains why a KPI moved (CTR, CVR, Quality Score components). A vanity metric looks impressive but doesn’t connect to either — impressions in isolation, account-average Quality Score, Ad Strength ratings.
The simple test: if the metric moves, can you tell the client what action to take? If yes, it’s a KPI or a useful diagnostic. If no, it’s vanity. Most agency reports treat all three as equally important. They aren’t.
ROAS stands for Return on Ad Spend. It’s revenue divided by ad spend, usually expressed as a ratio. A 4:1 ROAS means $4 in revenue for every $1 spent.
The catch: ROAS is a revenue metric, not a profit metric. A 4:1 ROAS on a product with $20 of margin shipped for free is not profitable. For products with varying margins, POAS is the better measure.
CPA stands for Cost per Acquisition (sometimes Cost per Action). It’s total ad spend divided by total conversions. It’s also a primary input for Target CPA bidding, which means the value you set has direct campaign consequences.
CPA only tells half the story without lead quality data. A $50 CPA where 10% of leads close is a $500 customer acquisition cost. The same $50 CPA at a 30% close rate is $167. Without CRM data flowing back to Google Ads, you’re optimizing for form fills, not customers.
CTR (Click-Through Rate) is clicks divided by impressions, expressed as a percentage. It tells you what percentage of people who saw your ad clicked it.
CTR has been demoted in modern PPC. It’s a diagnostic, not a KPI. High CTR with low conversion rate means wrong audience. Low CTR with high conversion rate means a creative problem. Reporting CTR as a headline metric is one of the most common reporting mistakes.
Conversion rate (CVR) is conversions divided by clicks. It tells you what percentage of clicks turned into the action you wanted — purchase, form fill, call, signup.
“Good” CVR depends entirely on the conversion type. A 7% form-fill rate is solid. A 7% purchase rate is incredible. Comparing across conversion types is meaningless. Always segment by traffic source — branded keyword CVR tells you nothing about acquisition.
Impression share (IS) is the percentage of available auctions you actually showed up in. If you got 6,000 impressions out of 10,000 eligible, your IS is 60%.
The full diagnostic identity: Search IS + Search Lost IS (Budget) + Search Lost IS (Rank) ≈ 100%. Those three numbers tell you exactly what’s holding you back. A target of 60–80% on priority keywords is healthy. Chasing 100% rarely makes economic sense — the marginal CPC required to capture the last 10–15% of impressions usually destroys ROAS.
POAS stands for Profit on Ad Spend. The math is simple: ROAS uses revenue, POAS uses gross profit. A 4:1 ROAS on a high-margin product is great; a 4:1 ROAS on something sold near cost is bankruptcy on a treadmill.
Break-even POAS is always 1.0. Typical targets land between 1.4 (controlled growth) and 2.0+ (max profitability). Implementation requires sending SKU-level margin data to Google Ads as conversion value, usually through a tool like Profitmetrics, Channable, or smec.
If your products have similar margins, ROAS works fine. If margins vary across SKUs, POAS is the right metric — and the gap matters more than most operators realize.
Smart Bidding optimizes against whatever conversion value you feed it. Feed it revenue, and the algorithm treats a 70%-margin serum and a 15%-margin razor as equally valuable when their revenue is the same. They’re not. Feeding profit instead of revenue redirects spend toward products that actually grow the business.
It depends on margin and channel. As a rough guide: Search campaigns average around 5:1, Performance Max around 2.5:1, and blended e-commerce Google Ads ROAS sits near 3.7:1. Display alone runs much lower (often below 1:1) because it’s typically a top-funnel format.
“Good” relative to benchmarks is less useful than “good” relative to break-even. A business with 25% gross margin needs ~4:1 ROAS just to break even before fixed costs. Calculate the floor first, then set the target above it.
ncROAS (New Customer ROAS) measures what you pay specifically to acquire new customers, separated from revenue from existing customers. Google Ads exposes it through Customer Lifecycle Goals, and it powers Performance Max’s high-value new customer mode.
Use it for any account where retention drives the LTV math — DTC brands, subscriptions, anything with repeat purchase. Aggregate ROAS often hides slow decline in new customer acquisition because branded searches by existing customers inflate the headline number while non-brand prospecting tanks. ncROAS surfaces that leak before retention plateaus and the business hits a wall.
CPL (Cost per Lead) is total spend divided by all form fills. CPQL (Cost per Qualified Lead) is total spend divided by leads that meet a qualification threshold — usually MQL or SQL.
The math gets ugly fast. If you’re paying $50 per lead and 5% qualify, your true CPQL is $1,000. The 95% of unqualified leads aren’t free — your sales team pays for them with their time. Implementation requires offline conversion import or CRM integration that flags qualified leads back to Google Ads. Once it’s set up, Smart Bidding optimizes for SQL volume instead of total form fills, and campaign quality changes immediately.
LTV:CAC compares the lifetime value of a customer to what you paid to acquire them. The healthy benchmark is 3:1 or better. Top quartile SaaS companies hit 5:1+.
For SaaS and subscription businesses, this is the only acquisition metric that makes sense. A first-touch ROAS of 0.5:1 looks catastrophic until you realize the customer pays $99/month for an average of 28 months. Pass LTV cohort data back to Google Ads as conversion value, then let Smart Bidding optimize against it.
MER (Marketing Efficiency Ratio) is total revenue divided by total marketing spend across every channel — Google, Meta, TikTok, email, affiliate, the lot. ROAS is platform-specific. MER is blended.
MER matters because Google Ads gets credit for conversions Meta actually sourced (and vice versa), so platform-level ROAS is always somewhat inflated. MER cuts through the attribution arguments by measuring whether the whole marketing engine is profitable. For DTC brands especially, MER is the metric the CFO actually trusts.
Original Conversion Value is a column that strips away all conversion value rule adjustments, new customer acquisition multipliers, and lifecycle bonuses. It shows raw revenue before any algorithmic manipulation.
It matters because the conversion value reported in the Google Ads UI often doesn’t match what the client sees in Shopify or HubSpot. Original Conversion Value is the bridge — it’s the version of ROAS that reconciles to the CRM. Add it to client reports when there’s a discrepancy between platform numbers and back-office numbers, which is most of the time.
IS Lost (Budget) means you ran out of money before all eligible auctions ran. The fix: raise the budget, assuming CPA/ROAS is on target. IS Lost (Rank) means your Ad Rank wasn’t competitive. The fix: improve Quality Score components, raise bids, or fix creative — never just add budget.
Confusing the two is one of the most expensive mistakes in PPC. Throwing budget at a Rank problem just spends more without showing more. Set up alerts on IS Lost (Budget) so you catch it the day it happens, not the day you sit down to write the monthly report.
No. Google’s own documentation states Quality Score should not be optimized or aggregated. The thing every agency reports as an account-wide average is something Google explicitly tells you not to aggregate.
Quality Score is a per-keyword diagnostic. The actionable information lives in the three component ratings — Expected CTR, Ad Relevance, Landing Page Experience — each shown as Below Average, Average, or Above Average. Look at those for specific underperforming keywords. Ignore the 1–10 number as a campaign health indicator.
Quality Score has a major impact on CPC. Roughly: a Quality Score of 10 earns about a 50% discount versus baseline, while a score of 1 carries a 400% premium. A score of 7 is around 29% cheaper than baseline; a score of 3 is around 67% more expensive.
That means Quality Score matters operationally even though it’s not a KPI. Two advertisers bidding the same amount can pay wildly different CPCs based on their relevance. The lever to pull is the component diagnostics, not the aggregate score.
No. Ad Strength — the rating from “Incomplete” to “Excellent” on responsive search ads — has zero impact on Ad Rank or auction performance. It’s an authoring guide, not a performance signal.
Optimizing for “Excellent” Ad Strength as if it were a KPI is a category error. Use it as a checklist for asset coverage if you want, then ignore it when evaluating campaign health. Judge ads by conversion rate by variant and CTR by audience, not by the Ad Strength label.
Auction Insights is a separate Google Ads report showing how you stack up against specific competitors in the same auctions. It includes Impression Share, Overlap Rate, Outranking Share, Position Above Rate, and Top of Page Rate.
Overlap Rate is the most actionable column — it shows who your real auction-level competitors are, which is often very different from who the client thinks. The boutique brand convinced they’re competing against the legacy player might find their actual auction overlap is with a DTC challenger they’ve never heard of. One constraint: Auction Insights data is no longer available outside the Google Ads UI (no Looker Studio, no API), so you have to pull it manually for client reports.
Cross-industry CPCs have been climbing for five consecutive years, with most recent annual increases around 12–13%. The drivers are structural: more advertisers competing for finite SERP space, increased automation that aggressively bids for the same auctions, and Google steadily reducing organic real estate in favor of ads.
There’s no realistic scenario where this reverses. The right response isn’t to lower CPC by chasing weaker keywords (which usually crashes conversion rate and raises CPA). It’s to watch the relationship between CPC and CVR — if CPC is rising but CVR is rising faster, you’re winning. If CPC is rising and CVR is flat, you’re losing ground.
When CVR drops while traffic stays flat, the cause is almost always one of three things. Test in this order: landing page degradation (slower load, broken element, copy change), audience shift (broad match expansion or AI Max pulling lower-intent traffic), or seasonal intent change (people researching versus buying).
Diagnostic shortcut: if high-intent search terms are landing on your page but not converting, the page is the problem. Fix the page before touching the campaign. If the search terms themselves have shifted toward research-mode queries, the campaign needs tightening.
For priority non-brand keywords, 60–80% is the healthy target. For brand keywords, push to 90%+ to protect against competitor encroachment.
Chasing 100% on non-brand terms rarely makes economic sense. The marginal CPC required to capture the last 10–15% of impressions usually destroys the unit economics. Better to capture 70% efficiently than 95% at a loss.
The cross-industry average is around 6.66% on Search. Variance is significant: Arts & Entertainment hits 13%+, while Business Services lands around 5.6%. For Display, expect 0.5–1%. For YouTube, judge by view rate instead.
Use industry benchmarks as sanity checks, not targets. The relevant comparison is your account against its own historical performance, then against the industry. A 4% CTR in legal services is solid; a 4% CTR in Arts & Entertainment is a problem.
The cross-industry Search average is around 7.5%, but the meaningful number depends on conversion type. Auto Repair sees 14%+ because the conversion (a phone call) is low-friction. Furniture hovers near 2.7% because the conversion (purchase) is high-friction.
Verticals with high CVR tend to have lower-commitment conversion actions. Verticals with low CVR usually have higher purchase intent or higher AOV. Don’t compare your ecommerce CVR to your competitor’s lead-gen CVR — you’re measuring different things.
The cross-industry Search average is around $5.26, but it ranges from under $2 (Arts & Entertainment, Restaurants, Travel) to over $8 (Attorneys & Legal Services, Dentists). Insurance, Career, and Home Improvement also routinely exceed $5.
| Vertical | Avg CPC |
|---|---|
| Arts & Entertainment | $1.60 |
| Restaurants & Food | $2.05 |
| Real Estate | $2.53 |
| Apparel/Fashion | $4.31 |
| Personal Services | $5.81 |
| Education | $6.23 |
| Home Improvement | $7.85 |
| Attorneys & Legal | $8.58 |
The cross-industry average is around $70. Cheap verticals (Auto Repair at $28, Restaurants at $30, Pets at $32) tend to have low-friction conversion actions. Expensive verticals (Attorneys at $131, Furniture at $121, Business Services at $103) involve higher-value transactions or longer consideration cycles.
Industry CPL benchmarks are useful sanity checks but misleading as targets. A $130 CPL in legal is fine if the average matter is worth $5,000. A $30 CPL in restaurants is bad if only 10% of leads ever transact. Always pair CPL with downstream conversion data.
Average Performance Max ROAS sits around 2.5:1 across industries — meaningfully lower than Search, which averages roughly 5:1. The gap reflects PMax’s blended traffic across YouTube, Display, Discover, and Gmail, which generally converts at lower rates than pure Search intent.
Don’t compare PMax ROAS directly to Search ROAS in the same report — you’ll make PMax look broken when it’s just a different campaign type doing a different job. Set separate targets for each, and use channel-level reporting to verify PMax isn’t quietly cannibalizing branded Search traffic.
Average YouTube CPM is around $3.50. Shorts run slightly higher at about $4. Connected TV (CTV) is much more expensive, ranging from $10 to $38 depending on inventory and targeting.
CPM only matters for awareness campaigns. For performance YouTube, judge by view-through conversions and assisted conversions, not impression cost. A higher CPM on a high-intent audience is usually cheaper per outcome than a low CPM on broad reach.
Yes. Performance Max now exposes conversion contribution by Search, YouTube, Display, Discover, Gmail, Maps, and Search Partners, plus a channel timeline view. You can finally answer the question every client has asked since Performance Max launched: “where is my budget actually going?”
You still can’t manually reallocate spend across channels — optimization stays algorithmic — but combined with Final URL reports, asset-level performance actuals, and PMax Auction Insights, the campaign type is no longer a black box. Add channel breakdowns to any client report where PMax accounts for meaningful spend.
AI Max for Search is an opt-in suite layered onto standard Search campaigns. It includes search term matching expansion, automatic text customization, and Final URL expansion. It’s not a separate campaign type. Dynamic Search Ads now auto-upgrade into it.
Track it with the search terms report (segmented by Match type), AI Max expanded matches, expanded landing pages, and conversion rate by match type to verify it isn’t lowering efficiency. Google’s pitch is +14% conversions at similar CPA for non-retail and +27% for keyword-heavy campaigns. Independent analysis suggests treating it like prospecting — volume expansion, often with higher marginal CPAs.
Modeled conversions are machine-learning estimates of conversions from users who didn’t consent to tracking. Google blends them into the standard Conversions column so bidding can still optimize against the full picture.
Eligibility requires properly implemented Consent Mode V2 plus at least 700 ad clicks per week per country and per domain. Below that volume, Google doesn’t have enough signal to model accurately. For accounts with EEA/UK traffic, modeled conversions can recover 10–20%+ of conversions that would otherwise be invisible to bidding.
Consent Mode V2 is Google’s framework for handling user consent under EU privacy law. It’s mandatory for traffic from the EEA and UK. Without it, Google silently disables conversion tracking, remarketing, and personalization for non-compliant accounts — some advertisers have lost 90% of their reported conversions overnight.
Even for accounts outside the EEA, properly implementing Consent Mode V2 unlocks modeled conversions and improves Smart Bidding signal quality. It’s no longer optional infrastructure. If a client serves any European traffic and hasn’t implemented it, that’s the first thing to fix before optimizing anything else.
Enhanced Conversions send hashed first-party customer data (email, phone, address) to Google to improve cross-device match rates. Target 50%+ coverage. Below 30% indicates an implementation problem worth investigating.
Verify coverage in Goals → Conversions → Diagnostics. The recovered match rate directly improves bidding accuracy, especially after iOS privacy changes shortened cookie windows. Pair with server-side Google Tag Manager, which bypasses ad blockers and extends Safari ITP cookies from 7 days to a full year.
Only two are meaningfully available now: Data-Driven Attribution (DDA) and Last Click. Google retired First Click, Linear, Time Decay, and Position-Based, auto-migrating affected accounts to DDA. The Model Comparison report is limited to comparing DDA versus Last Click.
DDA is the default for new conversion actions. The data requirement (~3,000 ad interactions and 300 conversions in 30 days) is the only meaningful gate. If you have the volume, use DDA. If not, use Last Click. Articles still listing six attribution model options as if they’re choices are out of date.
Use DDA whenever you qualify (about 3,000 ad interactions and 300 conversions in a 30-day window). It distributes credit across the full path based on actual contribution, which Smart Bidding can act on more intelligently than a single-touch model.
Last Click is the fallback for low-volume accounts. The trade-off: it systematically undervalues upper-funnel touches like YouTube and Display, which leads to underinvestment in awareness. For B2B journeys with 8–14 touchpoints, Last Click misses the majority of the actual influence.
The discrepancy almost always comes from three sources: conversion value rules adjusting reported revenue (new customer multipliers, lifecycle bonuses), attribution differences (Google credits assisted conversions; Shopify only sees the final purchase), and modeled conversions being added to the platform total.
Use the Original Conversion Value column to strip out adjustments and reconcile to the back office. For attribution gaps, expect Google Ads to over-report by 10–30% versus Shopify or HubSpot — that’s normal, not a bug. The CFO needs to see both numbers and understand which decisions each one informs.
Run every metric through three questions. Does it tie directly to a business outcome? If yes, headline it. If it moves, does the client know what action to take? If yes, keep it as a mid-deck diagnostic. Could a competing agency reproduce this report with no client context? If yes, it’s generic — replace it with a vertical-specific cut.
Every metric should pass question 1, or pass questions 2 and 3 together. Most reports include metrics that fail all three. Removing those is the single biggest reporting upgrade most agencies can make without buying a new tool.
Headline metrics: POAS (or ROAS if margins are uniform), ncROAS for new customer health, MER for blended marketing efficiency, AOV, and conversion rate. Diagnostics: CPC trend, IS Lost (Budget vs. Rank), and conversion value reconciliation between Google Ads and Shopify.
The most common e-commerce reporting mistake is applying one ROAS target across funnel stages. Prospecting at 2.5:1 is healthy if retargeting hits 6:1+ and the blend works. If margins vary by SKU, POAS isn’t optional — ROAS will systematically over-invest in low-margin products.
Headline metrics: Cost per Qualified Lead, MQL→SQL conversion rate, cost per opportunity, pipeline velocity, and closed-won revenue tied to ad source. Diagnostics: form-fill conversion rate, lead-quality score by campaign, and CRM-imported offline conversions.
The B2B mistake to avoid: optimizing for raw lead volume. Last-click attribution misses 60–85% of B2B revenue because journeys involve 8–14 touches. Send qualified leads back to Google Ads as primary conversions, ideally with tiered values ($500 for MQL, $1,500 for SQL, etc.) so Smart Bidding optimizes for pipeline contribution, not form fills.
Headline metrics: LTV:CAC ratio (target 3:1+), CAC payback period, trial-to-paid conversion rate, and cohort ROAS at 90/180/365 days. Diagnostics: signup-to-trial rate, activation rate, and qualified demo cost.
The SaaS mistake to avoid: optimizing for cheap signups. A $20 demo at 2% close rate costs more per customer than a $60 demo at 15% close rate. Until close-rate data flows back to Google Ads via offline conversion import, the algorithm can’t tell the difference between the two.
Headline metrics: qualified call rate, cost per qualified call, cost per booked appointment, and store visits where applicable. Diagnostics: call duration paired with outcome flagging, Google Business Profile interactions, and Local Services Ads cost per lead.
The local-services trap: only about 25% of Google’s auto-counted calls are real qualified inquiries. Counting calls by duration alone feeds the algorithm bad data, which then attracts more bad leads. Use call tracking with outcome flagging (booked/not booked, qualified/spam) so Smart Bidding optimizes for real business outcomes.
The recurring offenders: leading with impressions, clicks, or CTR as headline KPIs; confusing IS Lost (Budget) with IS Lost (Rank); reporting account-average Quality Score; optimizing for Ad Strength; using last-click attribution in B2B; counting all calls as conversions regardless of duration or outcome; applying one ROAS target across funnel stages.
Two more: failing to separate new versus returning customer revenue (which hides slow acquisition decline) and trusting in-platform conversions as the single source of truth without reconciling to the CRM. Every one of these can sit in a report unnoticed for months while the underlying business signal goes wrong.
Three cadences cover most needs. Real-time monitoring boards for budget pacing and IS Lost (Budget) alerts catch problems the day they happen. Weekly summaries cover trend direction and any campaign-level interventions. Monthly reports tell the strategic story — outcome metrics, year-over-year context, and what to do next quarter.
The report frequency mistake is monthly-only. By the time a budget cap shows up in a month-end deck, the client has already lost three weeks of profitable conversions. Real-time alerts on the few metrics that actually need action — IS Lost (Budget), conversion tracking failures, sudden CPA spikes — pay for themselves the first time they catch something.
Daily: spend pacing against budget, conversion volume versus the trailing average, IS Lost (Budget) on top campaigns, and any anomaly alerts on CPA or ROAS. Anything else can wait for weekly or monthly review.
The point of daily checks isn’t optimization — it’s catching breakage. Conversion tracking failures, sudden traffic spikes from broad match expansion, budget caps on profitable campaigns. These are the issues that compound if missed for a week. Set automated rules or alerts so you’re not manually scanning for them.
Add POAS to every client report with a one-time custom metric formula — then watch it auto-update across every account you manage.
Start Your Free Trial Today