
Under-reporting is when the work you do for a client outpaces what your reports actually show them, so the client sees a fraction of the value they’re paying for. It’s not a performance problem.
You can run a great month and still lose the account. Because the client never saw the great month. They saw three charts and a number that dipped.
That gap between what you do and what the client sees has a name in this article: the visibility gap. It’s quieter than a missed target and far more dangerous, because it punishes you for work you actually did. This piece will help you spot the gap in your own reporting, understand why it costs you renewals, and close it without burying clients in data they’ll never read.
The quick version:
- Under-reporting means your reports show less value than you’re actually delivering.
- The cost isn’t embarrassment. It’s churn. Clients renew on perceived value, and they can only perceive what you show them.
- The fix is not “send more.” Over-reporting is the opposite ditch, and it’s just as expensive.
- The real work is making the right things visible: outcomes first, a short note on what you did, and progress the client can track between reports.
- Most of this runs on autopilot once it’s set up.
What Under-Reporting Actually Means
Under-reporting is a mismatch between effort and evidence. The effort is real, and usually considerable. The evidence, the thing that lands in the client’s inbox, is thin, late, or so buried in raw numbers that the actual work disappears.
Think about a restaurant kitchen.
The diner orders the dish, eats the plate, and walks out. They never see the prep at 7 a.m. They never see the supplier the chef fired for bad produce, or the three plates sent back to the line before one was good enough to serve. If the meal is great, the diner assumes it was easy. And if it’s a little off one night, there’s no memory of the kitchen to fall back on, so they just decide the place has gone downhill.
Your reporting is the plate. Everything else is the kitchen: the bid adjustments, the negative keyword cleanups, the landing page tests, the budget you rescued the day a campaign started leaking.
Here’s the part that catches good agencies off guard. The better you are, the more invisible the work becomes. Smooth results look effortless. Effortless looks like something the client could maybe do themselves, or get it cheaper somewhere else.
That’s the trap. Under-reporting doesn’t make you look bad. It makes you look unnecessary.
The real damage shows up at renewal. Keeping a client is worth far more than the monthly invoice suggests, since the cost of winning a replacement dwarfs the cost of holding onto the one you have. The research most often cited here found that lifting customer retention by just 5% can raise profits by 25% to 95%. So every client who leaves because they couldn’t see your value isn’t a flat loss. It’s that loss, plus the cost of replacing them.
Which raises a question worth sitting with: what does your reporting actually prove on a Tuesday morning, when a client is half-consciously deciding whether you’re worth the spend?
How to Tell If You’re Under-Reporting
The clearest signs of under-reporting don’t show up in your reports. They show up in how the client behaves around them.
A client who can see your value asks sharp questions and plans ahead. A client who can’t goes quiet, gets surprised, or starts asking what they’re paying for. Run your own accounts against these signals. If two or three feel familiar, you’ve got a visibility gap.
- The client asks what you’ve actually been doing. Not as an attack, but a real question. The work isn’t reaching them.
- They’re surprised by results, good or bad. A client kept in the loop is never surprised. Surprise means they weren’t watching, which means you weren’t showing them.
- They reach out between reports for an update. If they have to chase you to know how things are going, your cadence isn’t doing its job.
- Renewal calls feel like starting from zero. You’re re-explaining months of work in one tense conversation, because none of it was ever made visible along the way.
- They fixate on one metric that dipped. With no context around it, a single down arrow becomes the whole story.
- Nobody opens the report. Reports going unopened month after month are reports going into the void.
Are You Under-Reporting? A 60-Second Self-Check
These signals show up in how clients behave, not in the report itself. Check the ones that sound familiar.
A client recently asked “what have you actually been doing?”
Clients get surprised by results (good or bad) when the report lands.
Clients reach out between reports asking how things are going.
Renewal calls feel like re-explaining months of work from zero.
A client fixated on one dipped metric with no context around it.
Your reports show low open rates month after month.
Two or three checked? You’ve got a visibility gap: the work is real, but the client can’t see it.
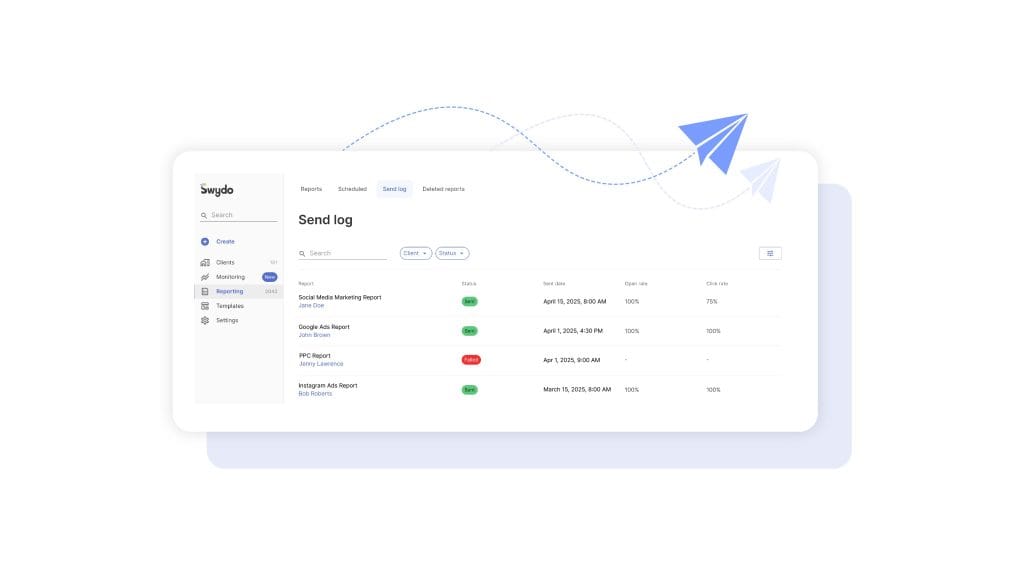
That last one is worth checking directly rather than guessing. The Send Log in Swydo shows delivery, open, and click rates per report, so you can see which clients actually open what you send.
An unopened report and no report are the same thing to the client. If your open rates are low, the problem usually isn’t that you’re sending too little. It’s that what you send isn’t worth opening, which almost always means it’s all data and no story.
Why Under-Reporting Quietly Drives Churn
Under-reporting drives churn because clients renew on perceived value, not delivered value. And perception is built entirely from what they can see.
When the work is invisible, the only things left to judge you on are the raw numbers and the invoice. That’s a fragile place to be.
The data backs the mechanism. A 2026 analysis of agency client churn put average annual client loss at roughly 18% for retainer agencies, around 42% for project-based shops, and as high as 49% for PPC specialists. Treat the exact figures as directional, since methodology varies across the industry, but the shape is consistent: a real slice of clients walk every year.
The more useful finding from that same analysis is why they walk. It named communication breakdown a “silent killer” of retention: clients who feel uninformed about what their agency is doing quietly start shopping for alternatives. Not poor results. Poor visibility.
Sit with that for a second, because it’s the whole argument. A client leaves not because the work was bad, but because they couldn’t see it.
So here’s the insight most agencies miss. Under-reporting is more dangerous than under-performing.
A client who watched you fight through a hard month forgives the hard month. They saw you in the kitchen. A client who saw nothing punishes a good month, because absence of evidence reads as absence of work. You aren’t judged on what you did. You’re judged on what you made visible.
If churn is already on your radar, track the leading indicators on purpose. The early signals that a client is heading for the door almost always show up in engagement long before they show up in revenue.
The Other Failure Mode That Looks Like a Fix
Over-reporting is the opposite failure, and agencies run straight into it while trying to escape under-reporting. The logic feels right. If too little is the problem, more must be the solution. So they bolt every available metric onto the report and ship a 40-widget dashboard.
It backfires for the same underlying reason. The client still can’t see the value, just for the opposite cause.
The Visibility Gap Has Two Edges
Under-reporting and over-reporting are opposite failures with the same result: the client can’t see your value. The target is the middle.
The work disappears
Thin or late reports, all numbers and no story. The client sees a fraction of what you do and starts to wonder what they’re paying for.
The value is obvious
Outcomes first, 5–9 headline KPIs, a short summary of the work behind them, and progress the client can track between reports.
The work drowns
Forty widgets and every metric the platform offers. The client feels the weight, can’t find the point, and closes the tab.
The visibility gap has two edges. On one side, you show too little and the work disappears. On the other, you show so much that the work drowns. When everything is on the report, nothing is important. The client opens it, feels the weight of forty numbers, and closes it.
You’ve technically reported everything and communicated nothing.
This is where most agencies overestimate their audience. You live in this data all day. Your client looks at it for ninety seconds a month, between two other meetings. And when the information coming at someone exceeds what they can process, they slow down, miss what matters, or abandon the task entirely. A wall of metrics isn’t transparency to them. It’s noise they have to decode, and most won’t bother.
I’ll be blunt about it. An activity dump isn’t a report, and a 40-tab dashboard isn’t transparency. It’s the work of judgment handed back to the person who hired you so they wouldn’t have to do it.
Picking what matters is the job. If you’ve forwarded every number the platforms gave you, you haven’t reported. You’ve abdicated. The same discipline that kills under-reporting kills over-reporting too: show the right things, framed so a busy human gets it fast. Part of that discipline is knowing which vanity metrics flatter the report without telling the client anything they can act on.
How to Close the Visibility Gap
Closing the visibility gap means making the right work visible: outcomes the client cares about, a short story of what you did, and progress they can track without waiting on you. It’s a handful of moves. Once they’re set up, most run on their own.
The goal isn’t more reporting. It’s reporting that earns its open.
1. Lead With Outcomes, Not Activity
Start every report with what changed for the client’s business, not what you did inside the ad platforms — outcome-first framing is what PPC reporting is supposed to do
Activity is “we launched four new ad groups and added 60 negative keywords.” Outcome is “cost per lead dropped 22% and you got 31 more qualified leads than last month.” The client cares about the second one. The activity is the proof underneath it, not the headline.
Same Work, Reframed So the Client Sees It
Activity tells the client what you touched. Outcomes tell them what they got. Lead with the right column.
| What you reported (activity) | What the client needed to see (outcome) |
|---|---|
| Added 60 negative keywords | → Cut wasted spend, dropping cost per lead 22% |
| Launched 4 new ad groups | → 31 more qualified leads than last month |
| Ran 3 landing page tests | → Lifted conversion rate from 2.1% to 2.8% |
| Reallocated budget across channels | → Same spend, 1.4x blended return on ad spend |
| Impressions up 40% | → (Cut it. Impressions aren’t an outcome) |
The test for any line: “We did this, which got the client that.” If you can’t name the “that,” it supports the story, it doesn’t lead it.
This is a reframing exercise more than a reporting one. Every activity metric you’re tempted to feature should pass one test: we track this because it answers [a question the client actually has], which affects [their business outcome]. If you can’t finish that sentence, the metric doesn’t lead. It supports, or it goes.
The KPIs that survive are usually a short list: revenue, leads, cost per result, and the one or two channel metrics that genuinely move the needle. Those are the numbers your client actually cares about, and they belong at the top.
2. Make the Invisible Work Visible
Give the kitchen work a place to show up.
Most of what you do every month is invisible by default, because reports are built for numbers, not narrative. So the bid changes, the tests, the saves never make it onto the page. A two- or three-sentence summary fixes that: what you did, what it changed, what’s next.
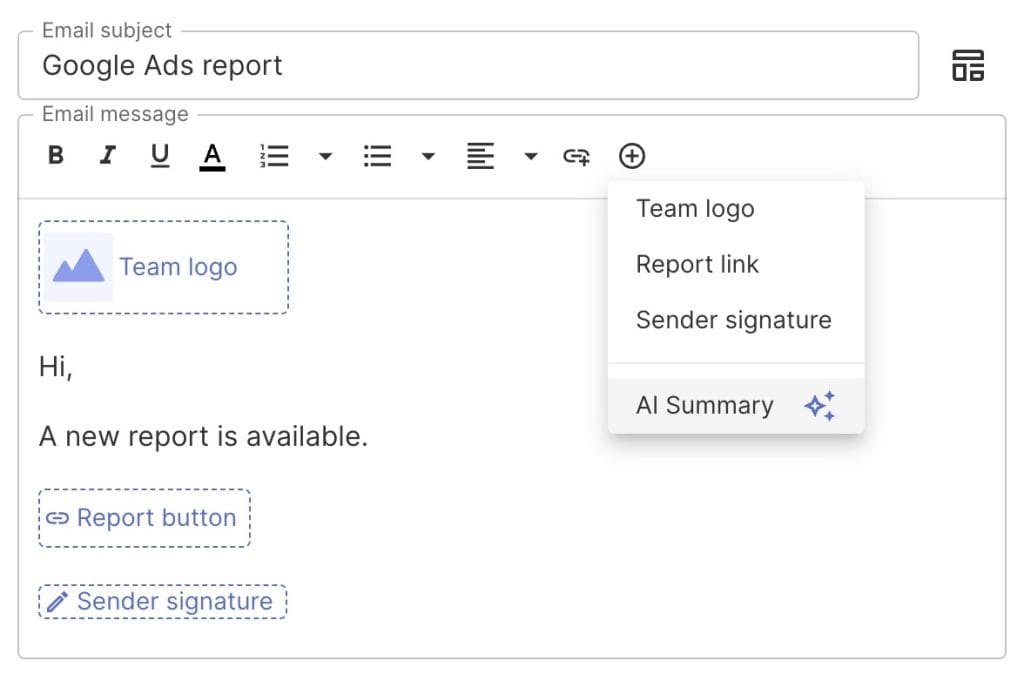
Writing that summary every month for every client is exactly the task that gets skipped when you’re busy, which is when it matters most. Swydo’s AI-generated email summaries handle the first draft. Drop the AI Summary block into the scheduled-report email once, and it writes a contextual recap into every future send. You edit for nuance, but you never start from a blank page, and the client gets the story alongside the data.
Want to go further on framing the numbers? The same principles apply to telling a story with the data in every report you send.
3. Set Goals the Client Can Watch Progress Against
Turn the work into visible progress by setting explicit goals tied to a target and a timeframe.
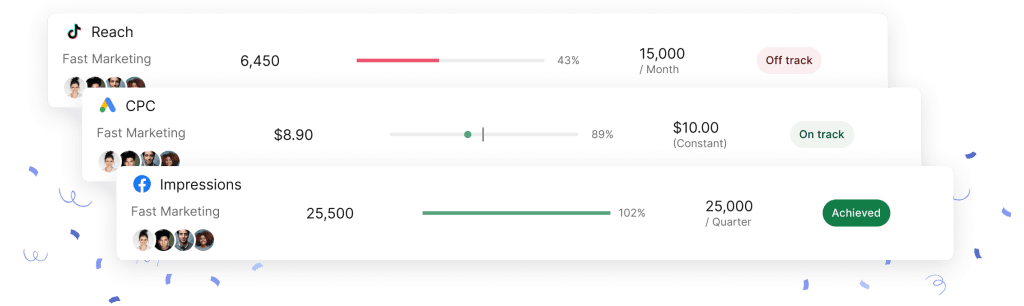
A goal converts your effort into a story with direction (“on track to hit 200 leads this quarter, currently at 142”) instead of a static snapshot the client has to interpret alone. It also reframes a soft month. A number that’s down looks like failure. A number pacing toward a goal looks like a plan in motion.
In Swydo, open Monitoring → Goals → New Goal, pick the client, data source, and metric, then set the target condition and period. Each goal shows as On Track, Off Track, or Achieved, and notifications can go straight to the client’s assignee at the end of the period or as in-progress updates.
The client stops wondering where things stand, because the answer is always in front of them. That’s the difference between monitoring and reporting: a report is a monthly photograph, while monitoring is the client watching the needle move in close to real time.
4. Don’t Make the Client Wait for the Monthly Report
Stop saving all your visibility for one day a month.
The monthly report is a terrible place to first surface a problem or a win. By the time it lands, the moment has passed. The client already noticed the dip, or missed the spike entirely. Proactive alerts close that gap.
Set an Alert in Swydo on the metrics that matter for each client: cost per acquisition spiking, conversions dropping, spend pacing oddly. The system checks daily and emails you the moment something crosses your threshold. You reach out before the client notices.
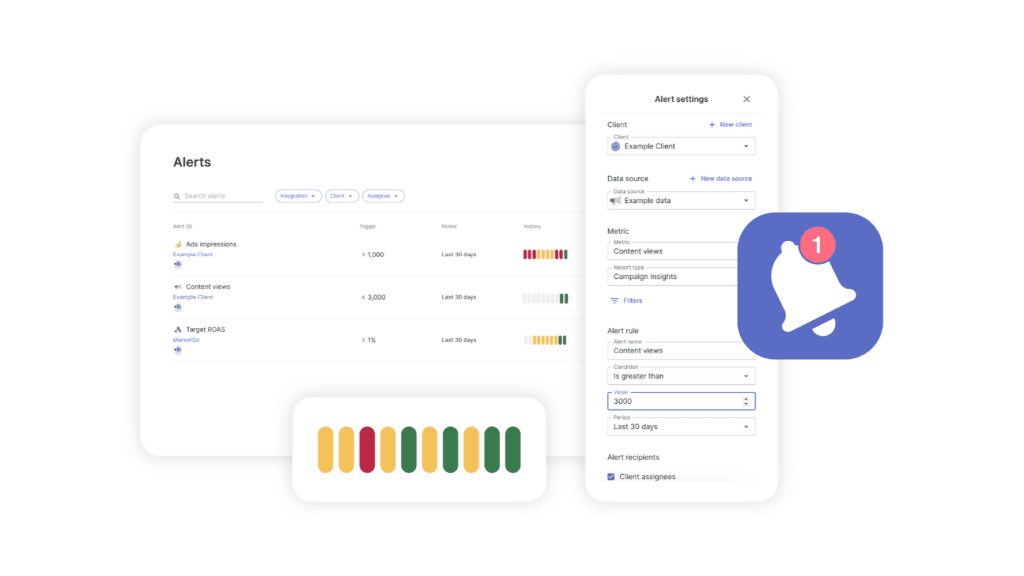
That flips the dynamic completely. Instead of explaining a problem in the monthly report, you’re the one who caught it on day two. It’s the behavior clients describe when they say an agency feels “on top of things.” It’s also the cheapest retention move there is, because being early is hard to tell apart from caring.
5. Match the Cadence to the Client, Not Your Calendar
Report at the rhythm the client actually needs, which is rarely “monthly for everyone.”
A six-figure-a-month e-commerce account in peak season needs weekly eyes. A stable local-services client on a small retainer might do fine with a tight monthly. Force both into the same cadence and you either starve the big client of visibility or bury the small one in reports they don’t want.
The honest cost conversation matters here, because cadence shouldn’t be throttled by your tool’s pricing. Swydo includes 10 data sources on the entry plan, unlimited users and clients, and reporting frequency doesn’t change what you pay (the part that matters for cadence). Send a client weekly, daily, or monthly; the cost is the same. Set the schedule once, and it runs.
Whatever the cadence, the fundamentals of solid client reporting best practices hold the same.
What to Put in the Report So Clients See the Value
A report that closes the visibility gap leads with outcomes, keeps the metric count tight, and tells the client what the numbers mean before it shows them the numbers.
Structure matters as much as data here. The same numbers can read as “you’re crushing it” or “what am I paying for,” depending entirely on how they’re framed. A reliable shape looks like this:
| Section | What it does | What to avoid |
|---|---|---|
| Executive summary | The one-paragraph story of the month: outcome, cause, next step | Saving the takeaway for the bottom |
| Headline KPIs (5–9) | The numbers tied directly to business goals | Listing every metric the platform offers |
| Channel detail | Supporting proof for the people who want it | Leading with this instead of outcomes |
| What we did | The kitchen work, made visible | A vague “ongoing optimization” |
| What’s next | The plan, so the client sees you thinking ahead | Ending on a number with no direction |
None of that means building from a blank page each month — a ready-made PPC report template already leads with outcomes and a tight KPI block, so you adjust instead of starting over.
The executive summary does the heaviest lifting on that list, and it’s the section most under-reporters skip. A client who reads only the first paragraph should still walk away knowing whether the month was good and why. If yours doesn’t clear that bar, the mechanics of writing an executive summary that lands are worth a look.
Past the summary, hold yourself to five to nine headline KPIs. More than that and you’re back in over-reporting territory. Fewer and you risk thin. For the full menu of what belongs in a marketing report, keep the bias toward outcomes a client’s boss would understand.
One more move closes the gap for cross-channel clients. When a client runs paid search, paid social, and shopping at once, reporting each channel separately hides the only number they really want: total return across everything.
Swydo’s Combined Data Sources blends up to five ad platforms into a single ROAS or revenue figure, so the client sees one honest cross-channel result instead of doing mental math across five tabs. Worth knowing the limit up front: custom metrics aren’t available inside a combined widget, so a bespoke calculated metric gets built separately. For the headline cross-channel number, though, it’s the cleanest way to show total value in one line.
Under-Reporting & the Visibility Gap FAQ
Direct answers to what agencies actually search about showing clients their value
Under-reporting is when your reports show less value than you’re actually delivering. The work is real and substantial, but what reaches the client is thin, late, or buried in raw numbers, so the work disappears and the client sees only a fraction of what they’re paying for.
The catch is that doing great work makes this worse, not better. Smooth results look effortless, and effortless looks like something the client could do cheaper somewhere else. Under-reporting doesn’t make you look bad. It makes you look unnecessary.
Under-reporting shows too little, so the work disappears. Over-reporting shows too much, so the work drowns. Both leave the client unable to see your value, just from opposite directions: a thin report hides the work behind one number, and a 40-widget dashboard hides it behind forty.
The fix for both is the same. Show the right things, framed so a busy person gets the point in under a minute. The target is the middle, not more and not less.
Neither. It’s better to give clients the right data, clearly framed. Dumping every available metric into a report buries the value as effectively as showing too little, because most clients won’t decode a wall of numbers. They look at your report for about ninety seconds, between two other meetings.
Picking what matters is the job you were hired for. Forward every number the platform offers and you haven’t reported, you’ve handed the work of judgment back to the client. Aim for five to nine headline numbers tied to their goals, and let everything else support those.
Vanity metrics are numbers that look impressive but tell the client nothing they can act on, like impressions, raw clicks, or follower counts with no business context. They flatter the report without proving value. “Impressions up 40%” sounds good but answers no question the client actually has.
The test for any metric is one sentence: we track this because it answers a real client question, which affects their business outcome. If you can’t finish that sentence, it’s a vanity metric. Lead with revenue, leads, and cost per result instead.
Watch how clients behave, not what’s in the report. The clearest signs: they ask what you’ve been doing, they’re surprised by results, they chase you for updates between reports, renewals feel like starting from zero, they fixate on one dipped metric, or nobody opens the report. Two or three of those and you have a visibility gap.
A client who can see your value asks sharp questions and plans ahead. A client who can’t goes quiet or starts asking what they’re paying for. The behavior tells you long before the churn does.
Usually because the report isn’t worth opening, not because you’re sending too little. Low open rates almost always mean the report is all data and no story. To the client, an unopened report and no report are the same thing.
Check it directly instead of guessing. Swydo’s Send Log shows open and click rates per report, so you can see which clients actually read what you send and fix the report before it costs you the renewal.
Because the work isn’t reaching them, only the results are. Most of what you do every month, the bid changes, the keyword cleanups, the tests, the budget you rescued, is invisible by default, because reports are built for numbers and not narrative. The client sees a clean outcome and assumes it was easy.
Fix it with a two or three sentence summary on every report: what you did, what it changed, what’s next. That short narrative is where the invisible work becomes visible, and the “what are you even doing” question goes away.
Yes, directly. Clients renew on perceived value, not delivered value, and reporting is how value gets perceived. Communication consistently ranks among the top reasons clients leave, ahead of campaign performance, so a client who can’t see your work is already drifting toward the exit.
One industry analysis called poor communication a silent killer of retention: clients who feel uninformed quietly start shopping around. Visible, well-framed work is one of the cheapest retention tools you have.
Because they can’t see the work behind the results, so a good month reads as easy or even unnecessary. Absence of evidence reads as absence of work. A client who watched you fight through a hard month forgives it, while a client who saw nothing punishes a good one.
You’re not judged on what you did. You’re judged on what you made visible. That’s why under-reporting is more dangerous than under-performing, and why a strong month with a weak report still loses accounts.
Far more than the monthly invoice, because winning a replacement costs much more than keeping the client you already have. Widely cited retention research found that improving retention by just 5% can raise profits by 25% to 95%.
So every client who leaves because they couldn’t see your value is a double loss: the revenue, plus the cost of replacing it. That math is exactly why making your work visible pays for itself.
Lead with results, every time. Activity is “we added 60 negative keywords and launched four ad groups.” Results is “cost per lead dropped 22% and you got 31 more qualified leads.” The client cares about the second one. The activity is the proof underneath it, not the headline.
Start every report with what changed for the client’s business, then show the work that caused it. Outcomes first, activity as supporting evidence.
A strong report has five parts: a one-paragraph executive summary that tells the story of the month, five to nine headline KPIs tied to business goals, supporting channel detail, a short “what we did” note, and a “what’s next” plan. Lead with the takeaway, don’t save it for the bottom.
Keep it skimmable. A client who reads only the first paragraph should still know whether the month was good and why. More than nine headline numbers and you’re back in over-reporting territory.
Report it more, not less, and lead with the context and the plan. Hiding a bad month or burying it in data destroys trust the moment the client notices. Name what happened, why it happened, and exactly what you’re doing about it.
Goals make this easier. A number that’s down looks like failure, but a number pacing toward a target (“142 of 200 leads, on track for the quarter”) looks like a plan in motion. Clients forgive a rough month they understand. They leave over one they were left to interpret alone.
Write it for your client and for the person your client answers to. Your report often gets forwarded up the chain to a boss who never speaks with you, so it has to make your day-to-day contact look good to their leadership. Use outcomes a non-marketer would understand.
That’s why revenue, leads, and cost per result belong at the top, and platform jargon doesn’t. A report your client can forward without translating is a report that protects your account.
Combine the channels into a single figure instead of reporting each platform on its own. When a client runs paid search, paid social, and shopping at once, separate tabs hide the only number they really want: total return across everything.
Swydo’s Combined Data Sources blends up to five ad platforms into one ROAS or revenue figure, so the client sees one honest cross-channel result instead of doing mental math across five tabs. One limit worth knowing: custom metrics aren’t available inside a combined widget, so a bespoke calculated metric gets built separately.
Match the cadence to the client’s spend and stage, not one company-wide rule. A high-spend e-commerce account in peak season needs weekly visibility, while a stable, low-retainer client is often fine with monthly. Force both into the same rhythm and you either starve one or bury the other.
Don’t let pricing decide cadence for you. With Swydo, reporting frequency doesn’t change what you pay, so you can send weekly, daily, or monthly based purely on what the client needs.
Yes. The monthly report is the worst place to first surface a problem, because by the time it lands the client has already noticed the dip or missed the win. Proactive alerts let you reach out the day something changes.
Set alerts on the metrics that matter, like cost per acquisition spiking or conversions dropping, and you become the one who caught it on day two. You look on top of things, and being early is hard to tell apart from caring, which makes it the cheapest retention move there is.
A report is a monthly photograph. Monitoring is the client watching the needle move in close to real time. Reporting tells the client where things stood, while monitoring shows them where things stand right now, against a goal.
Goals and alerts turn a static monthly snapshot into live progress the client can track without waiting on you. That shift, from “here’s what happened” to “here’s where we are,” is what makes an agency feel on top of things.
Only if you automate the wrong part. Automate the assembly, pulling the data and building the charts, and personalize the story. Clients don’t want a hand-built spreadsheet. They want to understand what happened and feel like someone is paying attention.
Swydo can even draft the email summary for you, so the recap is contextual instead of blank-page work and you edit for nuance. The result feels more attentive, not less, because the time you save goes into the thinking rather than the formatting.
Next Steps
The visibility gap closes in three moves, and none of them mean working more hours. Lead your next report with the outcome instead of the activity. Add a two-sentence summary that names the work behind the numbers. Then set one goal and one alert per client, so progress and problems reach them without waiting for the monthly send.
Pick your most at-risk account and start there. Open its next report, cut it to the five to nine KPIs that map to the client’s real goals, and write the executive summary first.
You’ll feel the difference in the next renewal conversation. Because for once, the client will already know the answer.
Show clients the value behind every result and keep them longer.
Start Your Free Trial Today