X Analytics Report

X Analytics Report Template

Swydo’s pre-built X Analytics report template instantly turns your data into clear, actionable insights. Track campaign performance, measure ROI, and identify growth opportunities—all in one automated dashboard.

Perfect for agencies and marketers who need to: Prove social media value to clients and save hours on monthly reporting.

Data sources X (Twitter) Ads X Analytics
▶ Get started

Free for 14 days

No credit card required

Cancel anytime

X Analytics Report

How it works

select template white

1. Select

Choose one of our predefined templates or create your own

connect white

2. Connect

Connect your data sources

customize white

3. Customize

Customize your data to meet your client’s needs

share white

4. Share

Schedule and share a dashboard or PDF report with your team or clients

Choose Swydo's X Analytics Template

Save time, impress clients, and grow your agency with Swydo's automated reporting solutions.

Swydo item

Save Hours
Streamline reporting and reclaim your day.

Swydo item

Actionable Insights
Present key X Analytics metrics in a way that clients instantly understand.

Swydo item

All-in-One Reporting
Visualize, share, and manage all your X Analytics data from one spot.

Swydo item

Custom Branded Reports
Present clients with tailored, on-brand X Analytics reports.

Swydo item

Agency Mark-up
Set your agency markup once. Flat or percentage & auto-apply.

Swydo item

Win More Business
Impress in pitches with X Analytics reports that showcase your expertise.

Why Your Agency Needs an X Analytics Report Template

As a marketer, you want to drive results, not format spreadsheets. Save hours tracking X campaign performance with automated, branded reports that showcase real-time platform expertise.

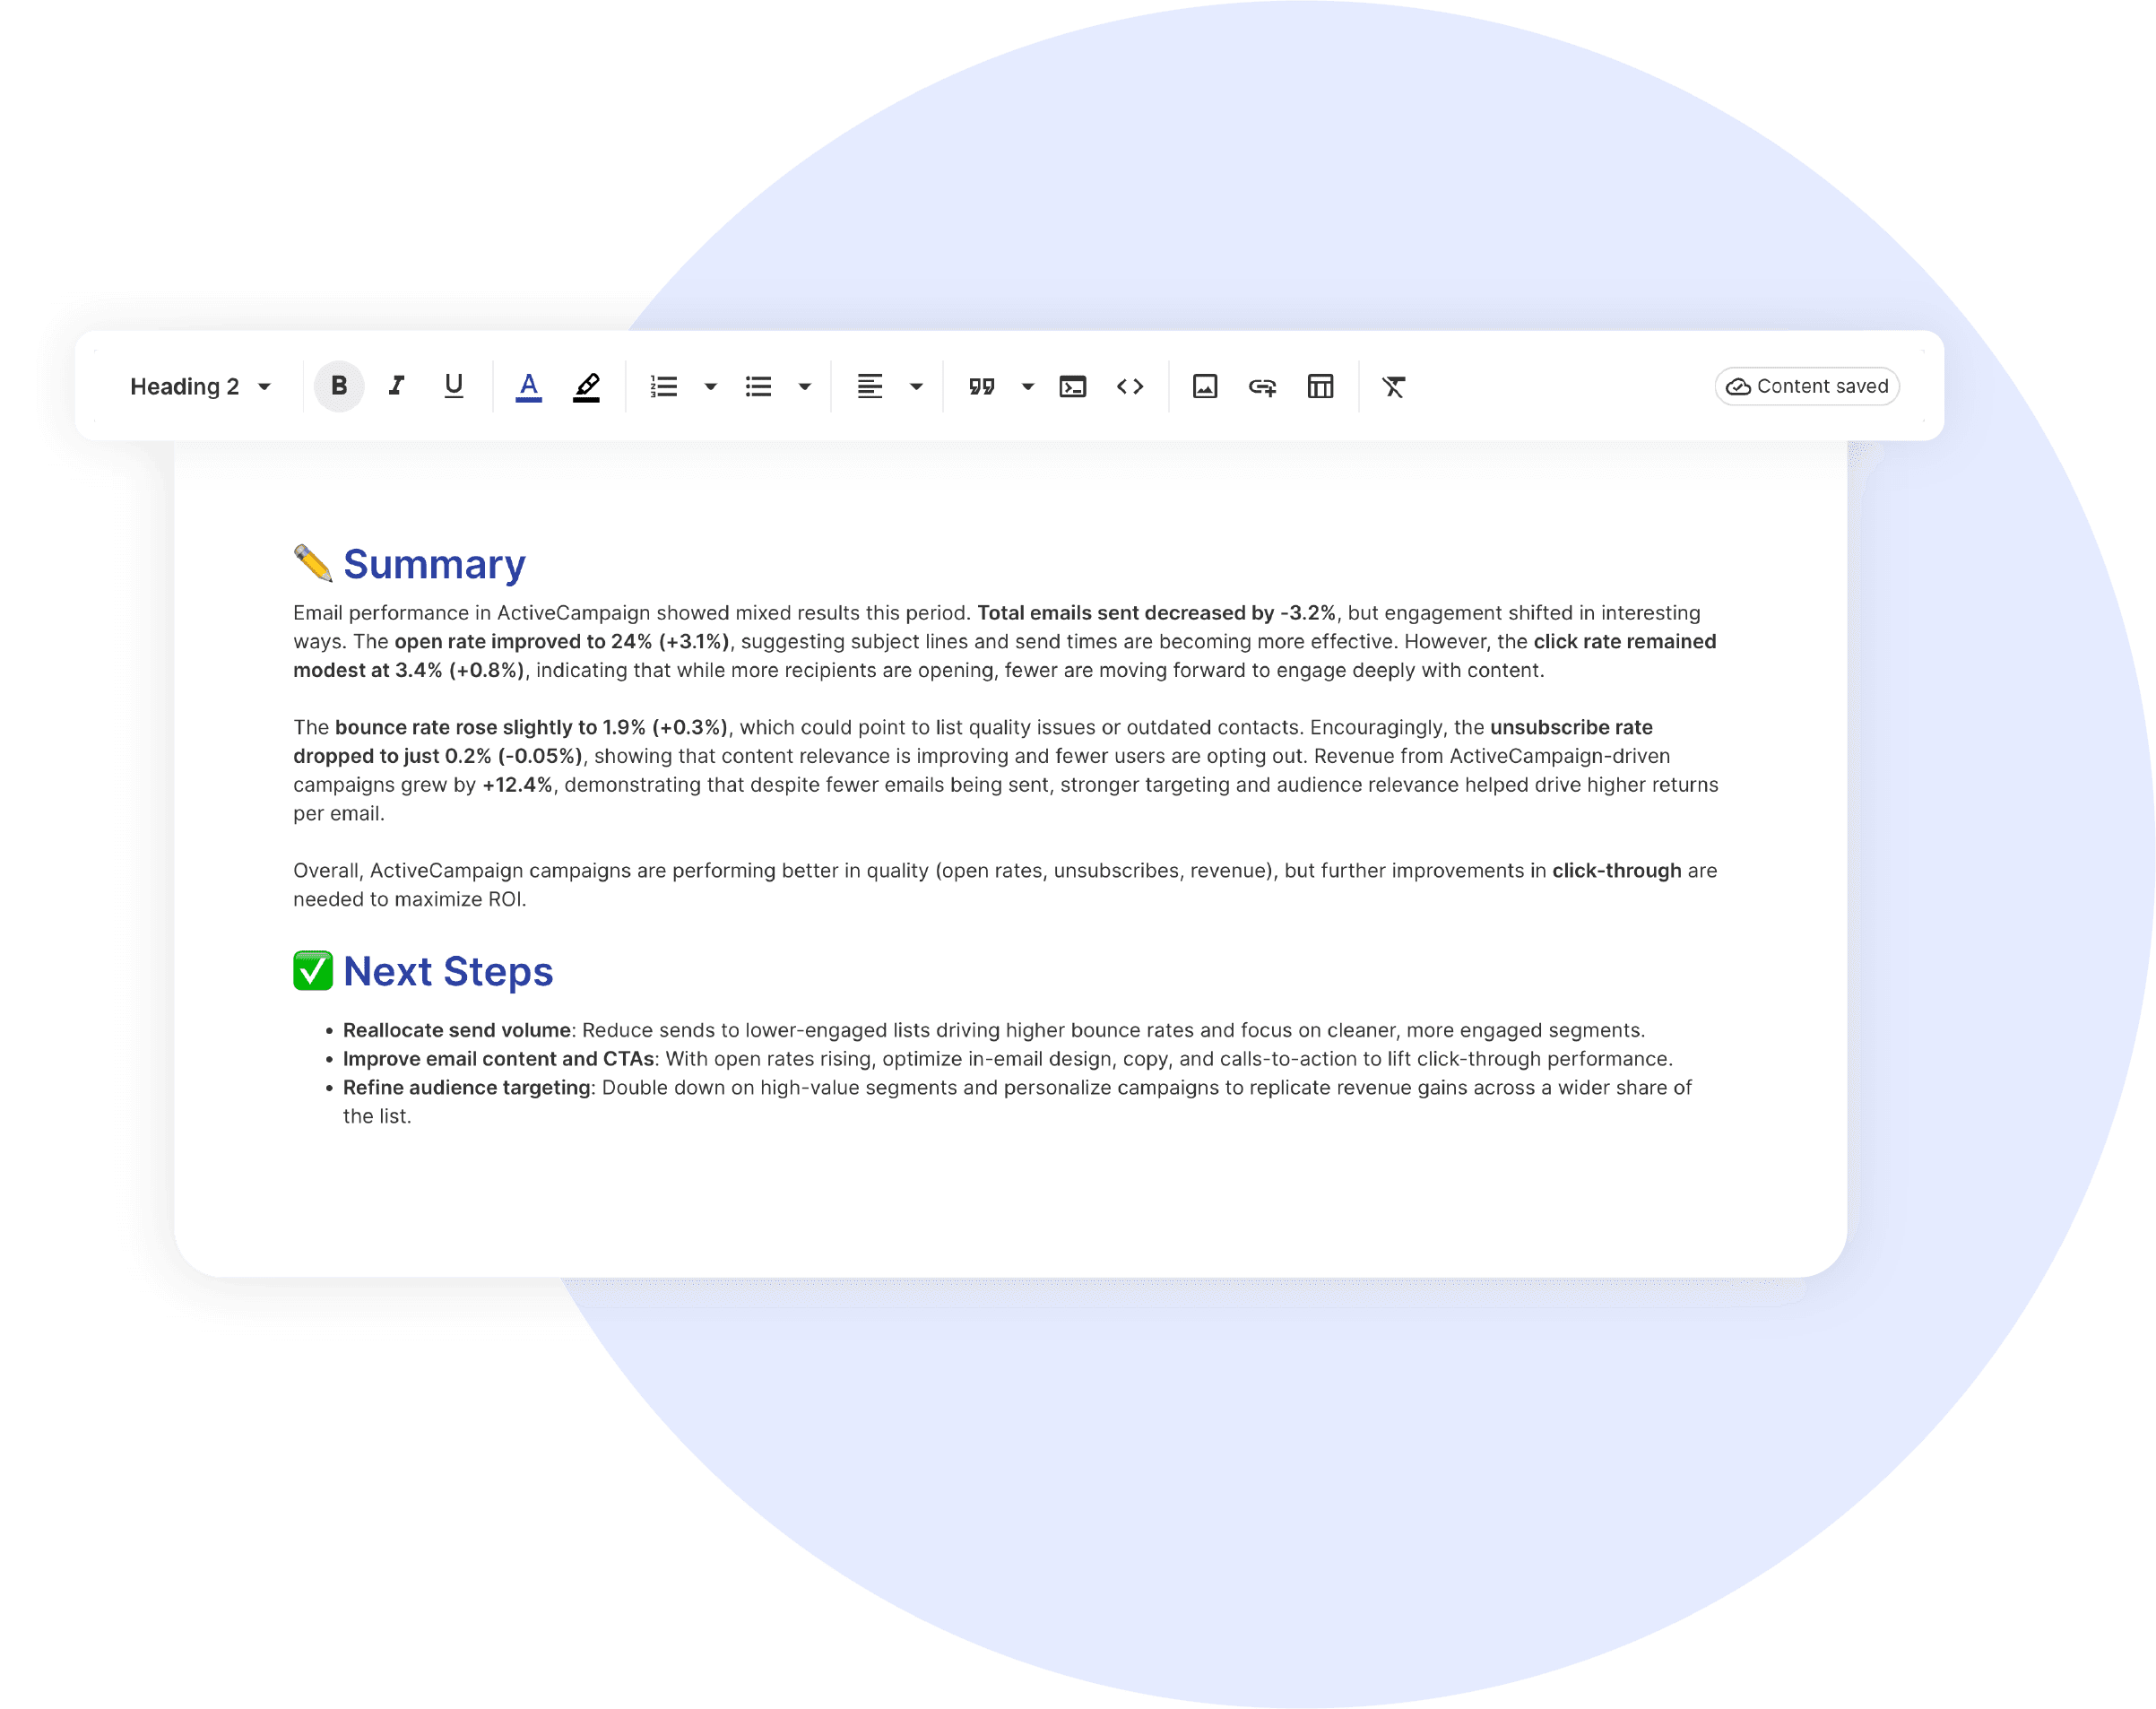
Every minute spent wrestling with X data is a minute stolen from strategy. A good X analytics template transforms scattered social metrics into stories clients actually understand.

No more late nights before presentations, no more explaining complex engagement metrics from scratch, just clear insights that showcase your X expertise and justify your premium fees. This X Analytics report template transforms chaotic campaign data into clear, compelling client presentations in minutes, not hours.


What Makes Swydo’s X Analytics Report Template Different?

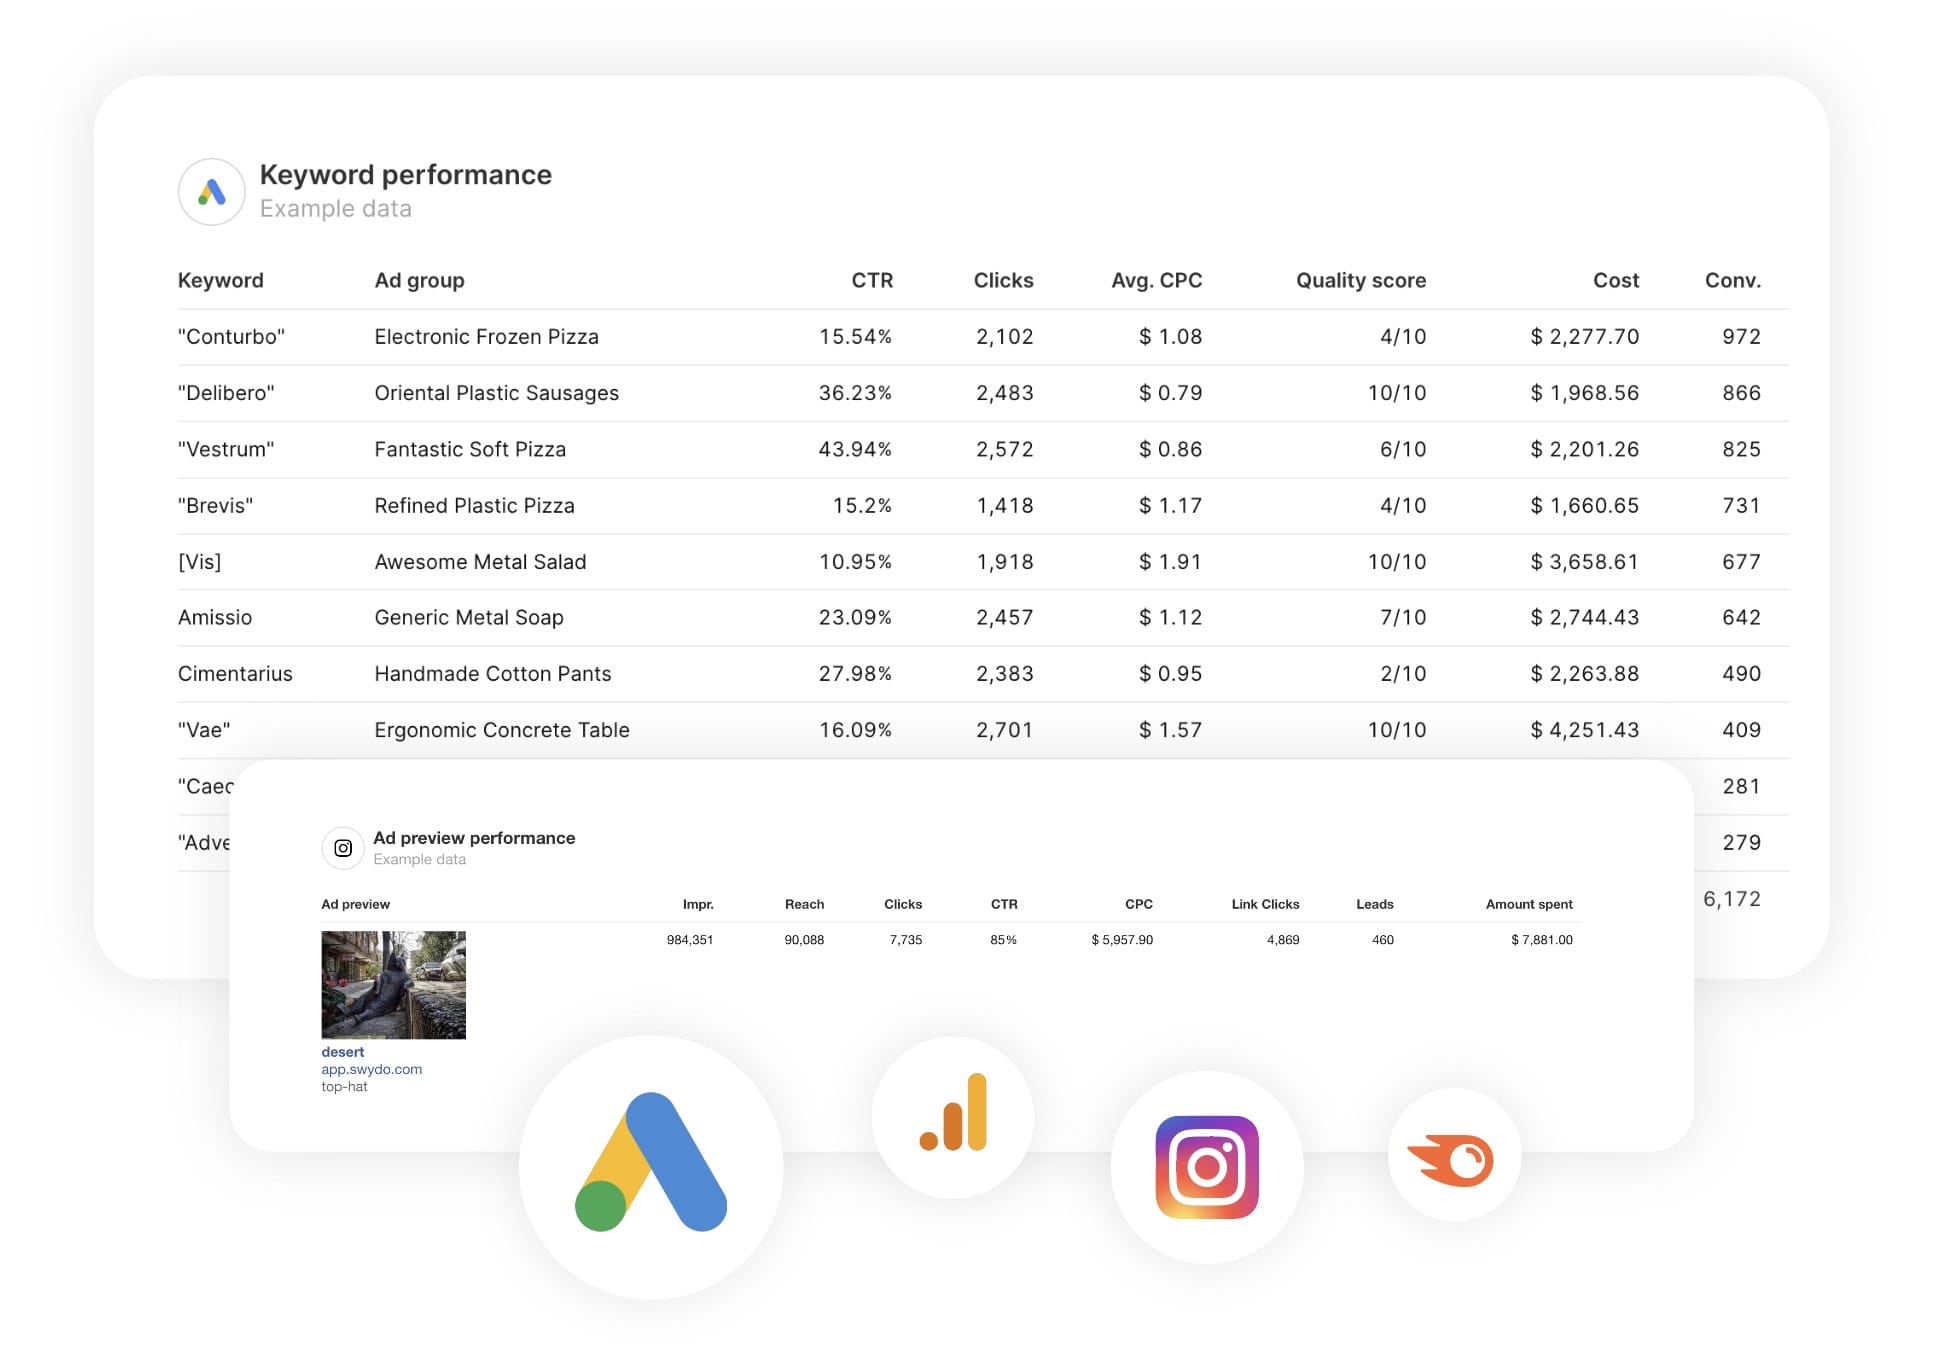
X-Native Integration
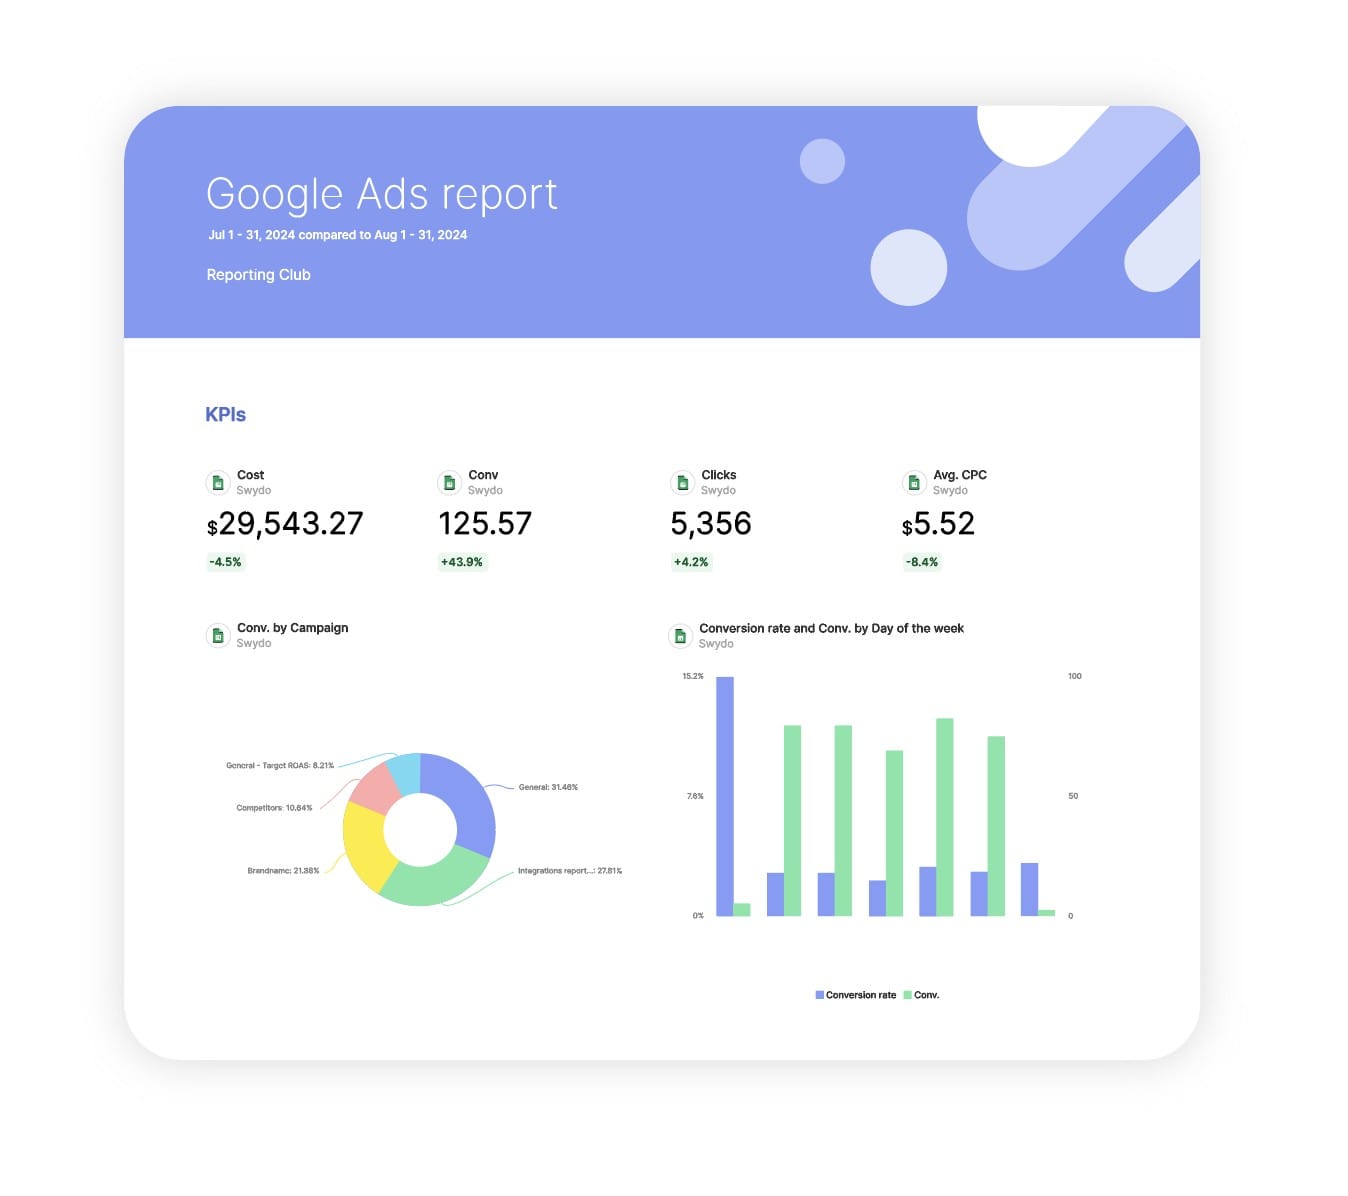
Track metrics that matter on X: engagement rate, video views, profile visits, reposts, and replies. No generic social media metrics—just X expertise that shows real performance.

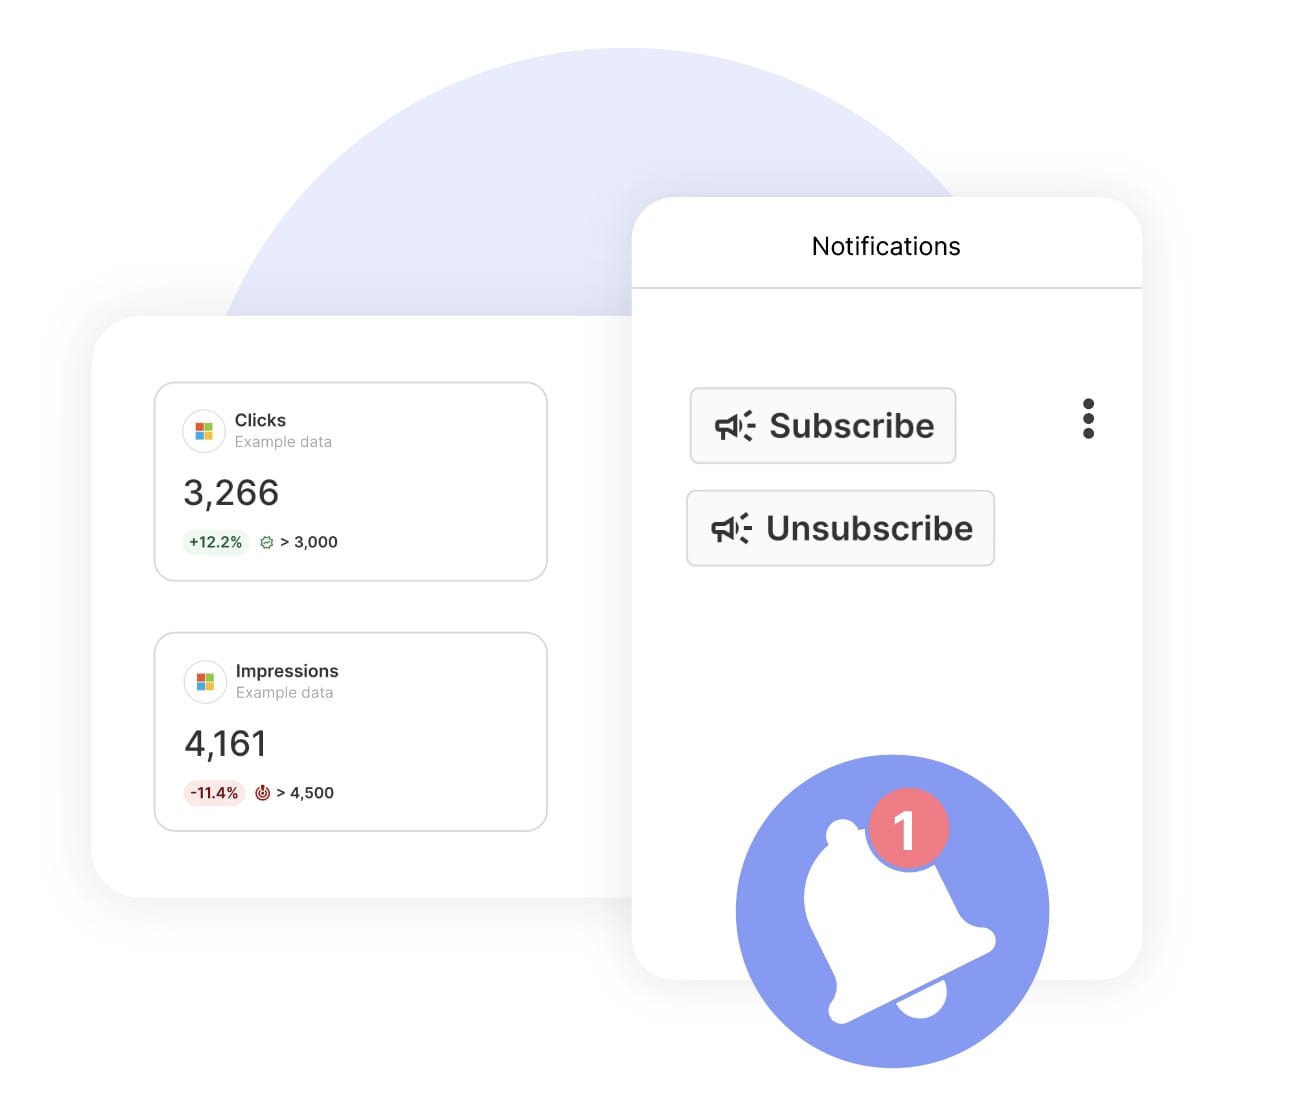
Real-Time Platform Focus
X isn’t Facebook. Our template highlights conversation velocity through replies and reposts, measuring the real-time engagement that makes X unique for brand building.

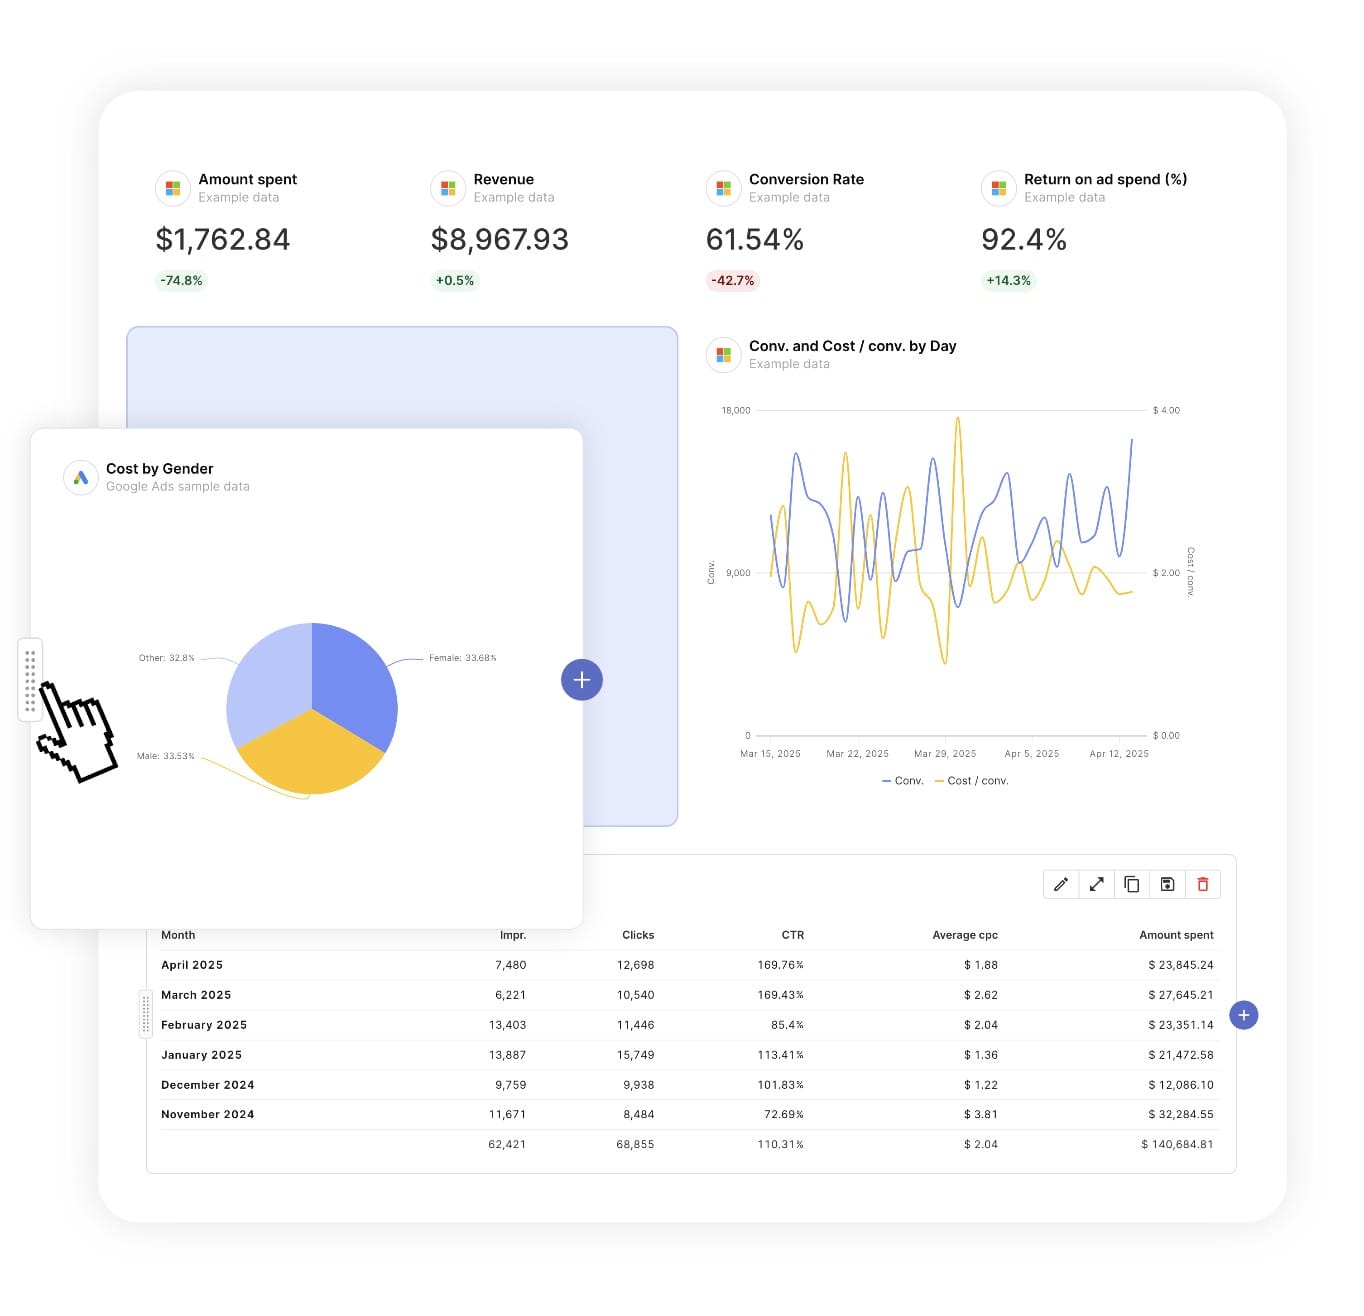
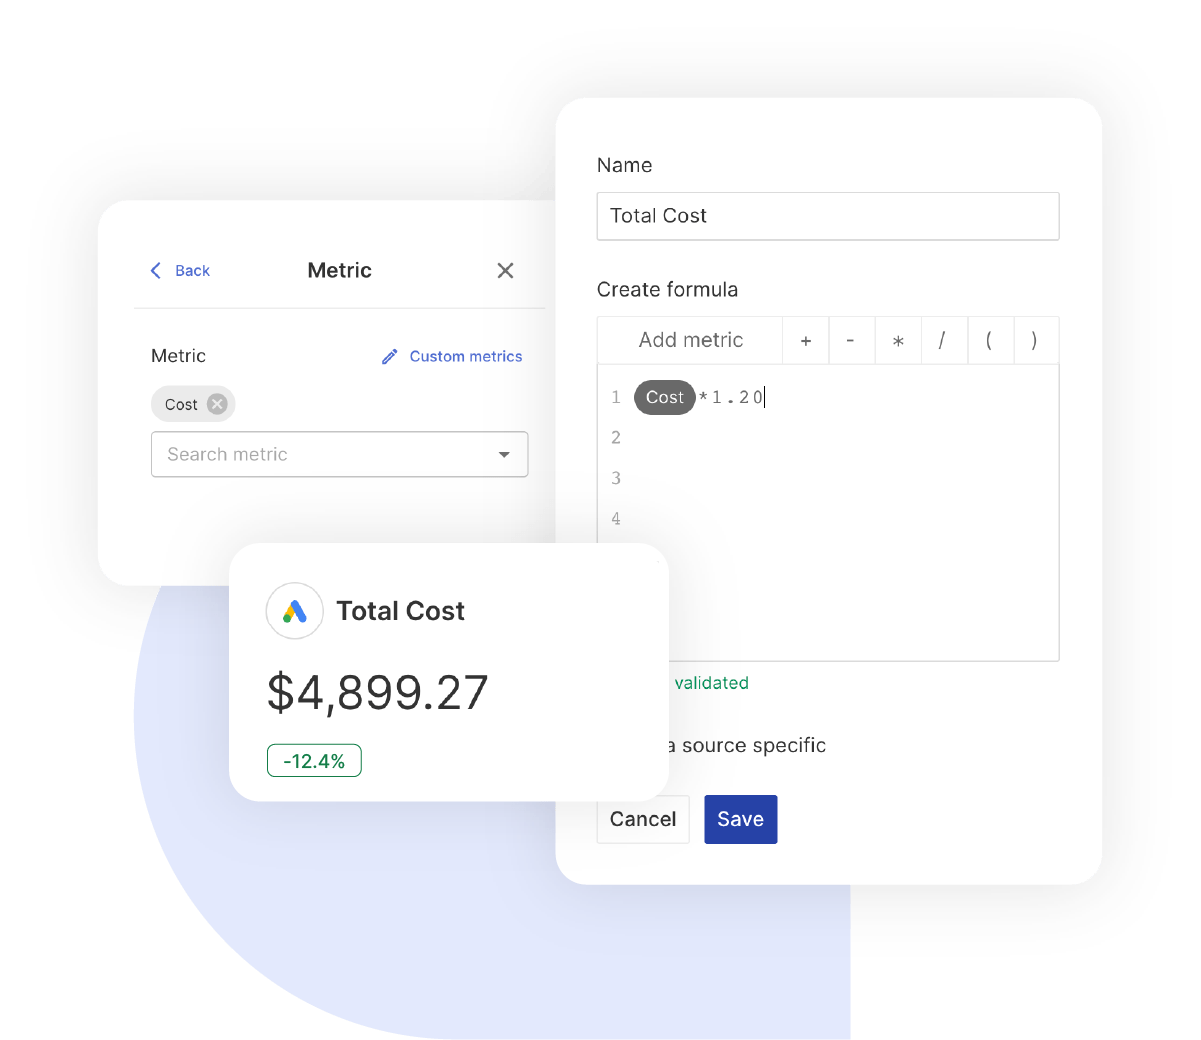
Custom Metric Intelligence
Create powerful custom calculations combining impressions, engagement, and likes. Build metrics that tell your client’s unique success story with automated period-over-period comparisons.


What To Include In An X Analytics Report

Create professional, white-label X Analytics report templates that track critical metrics, deliver actionable insights, and prove organic performance with X’s authentic engagement data.

Executive Summary With X Performance Indicators

What to include in your X report summary:

  • Lifetime Followers & Lifetime Following – Total audience size and community building metrics
  • Overall Performance Snapshot – Video views, engagement, reposts, profile visits, and replies with period comparisons
  • Top-Performing Tweets – Best content by engagement rate for quick wins identification
  • Performance Trends – Period-over-period percentage changes showing growth or decline

Perfect for stakeholder presentations and monthly X performance reviews.

Overall Performance Tracking

Foundation metrics every X report template should track:

  • Video Views – Total video content views showing visual content performance with period comparison
  • Engagement – Total interactions including likes, replies, reposts, and clicks with percentage change
  • Reposts – Content amplification showing shareability and reach extension
  • Profile Visits – Brand interest indicator measuring account discovery trends
  • Replies – Conversation depth showing genuine audience dialogue quality

Essential metrics that demonstrate X campaign health with period-over-period percentage changes for instant performance assessment.

Lifetime Followers & Following Metrics

Audience foundation tracking to include:

  • Lifetime Followers – Total follower count showing overall audience size
  • Lifetime Following – Total accounts you follow for community building and relationship tracking
  • Follower-to-Following Ratio – Understand account authority and engagement dynamics
  • Growth Context – Baseline metrics for measuring acquisition success over time

Show the foundational audience metrics that contextualize all engagement performance.

Tweet Performance Analysis

What to include for content optimization insights:

  • Individual Tweet Breakdown – Every tweet with thumbnail preview, @handle, date posted, impressions, likes, total engagement, and engagement rate
  • Top-Performing Content – Sort by engagement rate to identify highest-performing tweets
  • Impressions per Tweet – Visibility measurement showing content reach
  • Engagement Rate Ranking – Percentage-based sorting to identify winning content patterns for replication
  • Total Performance Summary – Aggregate totals showing cumulative impressions, likes, engagement, and overall engagement rate

Show exactly which content resonates with detailed performance data and visual tweet previews for easy identification.

Engagement Metrics Deep Dive

Core engagement tracking to include:

  • Total Engagement – Combined likes, replies, reposts, and clicks per tweet and in aggregate
  • Engagement Rate – Engagement divided by impressions for efficiency measurement (the most critical X metric)
  • Likes – Appreciation metric showing content resonance
  • Reposts – Amplification metric showing content shareability in overall performance section
  • Replies – Conversation starter metric measuring dialogue quality in overall performance section

Track what drives genuine interaction beyond passive scrolling with granular per-tweet and aggregate data.

Video Performance Tracking

Video-specific metrics to include:

  • Video Views – Total video content consumption with period comparison
  • Video View Trends – Period-over-period comparison showing video strategy effectiveness
  • Video Engagement – How video tweets perform in overall engagement metrics
  • Video Content Identification – Visual thumbnails in tweet performance table showing which posts include video

Demonstrate video content performance with clear trending data and context within overall strategy.

Profile Visit Analysis

Brand discovery metrics to include:

  • Total Profile Visits – How many users clicked through to view your full profile
  • Profile Visit Trends – Period-over-period changes showing brand interest trajectory
  • Profile Visit Context – Understand if content drives profile discovery and deeper brand exploration
  • Discovery Patterns – Correlate high-engagement tweets with profile visit spikes

Track brand awareness and consideration through profile visit behavior as a leading indicator of audience interest.

Period-Over-Period Comparisons

Performance trending essential for every report:

  • Date Range Comparisons – Current period vs. previous period with clear date ranges
  • Percentage Change Indicators – Clear visual indicators showing growth or decline
  • Multiple Metric Trends – Compare video views, engagement, reposts, profile visits, and replies simultaneously
  • Performance Context – Understand if strategies are working through directional trend data

Essential for showing clients progress, momentum, and areas needing optimization with clear visual percentage badges.

Custom Metrics & Calculations

Powerful custom metrics you can create from available data:

  • Engagement Efficiency – Total engagement divided by impressions for content quality scoring
  • Average Engagement Rate – Total engagement rate divided by number of tweets for baseline performance
  • Reply Rate – Replies as percentage of total engagement for conversation quality measurement
  • Repost Rate – Reposts as percentage of total engagement for content shareability scoring
  • Profile Visit Rate – Profile visits as percentage of total impressions for brand interest measurement
  • Video Performance Ratio – Video views as percentage of total impressions for video strategy effectiveness

Combine X metrics to create insights unique to your client’s success story and strategic priorities.

Strategic Recommendations & Next Steps

What every X report template needs for action:

  • Content Optimization – Replicate tweet formats and topics from highest engagement rate performers
  • Engagement Enhancement – Increase replies and reposts through conversation-starting content strategies
  • Video Strategy Adjustment – Address video view declines or capitalize on video content strengths
  • Profile Visit Drivers – Identify which content types drive profile visits and create more discovery-focused tweets
  • Consistency Analysis – Maintain momentum when metrics grow, diagnose issues when metrics decline

Position your agency as X analytics expert with data-driven recommendations backed by actual performance from the report.

CUSTOMIZATION

Customize Your X Analytics Report

FiltersLeverage a variety of filters to show more specific data points to quickly identify issues and take swift action.

SchedulingAutomate and share your dashboards and reports on a schedule that best meets your needs.

White labelReflect your brand by incorporating your logo and brand colors into your reports. You can also use your domain to share and send your reports.

GoalsSet and track goals to gain insight into performance, trends and progress toward your goals.

Custom MetricCombine two metrics from the same data source to calculate an entirely new custom metric.

Multi-language reportsCreate reports for your clients in 14 available languages through our automatic and editable translation feature.

Report DesignResizable widgets allow you to adjust the presentation of KPIs, charts, tables, text, and images to focus clients on key data and insights.

Text and ImagesProvide context to clients or stakeholders through descriptive text widgets. Incorporate images, such as ad assets, to improve client communication and understanding.

Flexible Date RangesEasily compare data across different time periods. Fully control the date range of your overall reports or specific KPIs, charts, and tables to highlight trends.

See all features
Social Media Report Templates

Choose a template, connect your ad accounts, and deliver professional social media reports in minutes.

Connect With Your Favorite Data Sources

Easily Connect & Integrate Data in a Single Report

FAQ

Frequently Asked Questions

  • Can I move my existing X Analytics reports to Swydo?

    Yes. If you’re switching from another reporting tool you don’t have to rebuild everything by hand. Swydo’s migration service recreates your existing client reports and dashboards inside Swydo, so your team keeps its layouts and clients see no disruption. Connect your X Analytics data, hand over your current reports, and pick up where you left off. See the migration service →

  • Can I white-label X Analytics reports with my agency's branding?

    Yes. Add your logo, brand colors and fonts, then host live dashboards on your own domain (reports.youragency.com) and verify your sending domain so scheduled reports arrive from your brand with no “via Swydo” tag. Dashboards can be password-protected, the Send Log shows which clients opened and clicked each report, and you can embed Crisp chat in a client dashboard so questions get answered in context. See white-label features →

  • Is my X Analytics data secure, and is Swydo GDPR-compliant?

    Yes. Swydo connects through OAuth wherever the platform supports it, and scoped API keys for Klaviyo, CallRail, CallTrackingMetrics and ActiveCampaign, so you only share the access you authorize and can revoke it at any time. Swydo is GDPR-compliant, your data stays yours and is never used to train AI models, and you can switch on two-factor authentication for every sign-in. Deleted reports stay recoverable for 90 days and archived clients for 365 days. Read our data privacy and security details →

  • What does Swydo cost after the free trial, and can I pause or cancel?

    The 14-day trial needs no credit card. Plans start at $69/month and include 10 data sources, Additional data sources cost $2–$4.50 each, and the per-source rate drops as you scale — no per-client fees, no per-user fees, and unlimited seats. Reporting frequency never changes the price. If you hit a quiet stretch you can pause your subscription for $10/month and reactivate when you need it, and you can cancel any time with no auto-renewal trap. See full pricing → or book a 15-minute pricing walkthrough →

  • What should an X (Twitter) Analytics report include?

    An X Analytics report should show organic reach and engagement over time. Include impressions, engagements, engagement rate, profile activity and top posts. Because activity tracks real-time conversation, note the context behind any spikes so clients can read them correctly.

  • What X organic metrics can I track in Swydo?

    Swydo reports organic X metrics including impressions, engagements, engagement rate and profile activity. Note that the X API returns only the past 30 days of post data, so a regular schedule matters to keep history complete. See the X integration →

  • How often should I send X Analytics reports?

    Monthly works, but since the X API only exposes the last 30 days, a consistent weekly or monthly schedule ensures you capture data before it ages out. A live dashboard helps in between. See scheduling →

  • How do I set up and automate an X Analytics report?

    About 10 minutes — authorize X via OAuth, choose the account, and load the template. It fills with available data and refreshes daily, then schedules itself. Free for 14 days, no credit card required. Start your free trial →

  • Can I combine X with my other social channels?

    Yes. Pair X with Facebook, Instagram, LinkedIn and your other channels in one report for a unified social view. See all social integrations →

Client testimonials

Discover Why Over 2,500 Agencies Trust Swydo


View all customer stories

Create your free online marketing report in minutes

Free for 14 days, no credit card required, cancel at any time

Request a demo ▶ Get started